Blue Chips, Short Puts & Corrections

Since Oct. 12, the S&P 500 is down over 7%, and over that same period, some of the largest capitalized stocks in the United States are down significantly more—a development that has opened up a plethora of new investment and trading opportunities.
The list below highlights some of the recent carnage in the large-cap space (since Oct. 12):
- Tesla (TSLA): -15.9%
- Apple (AAPL): -12.5%
- Visa (V): -12.2%
- Nvidia (NVDA): -11.9%
- Amazon (AMXN): -11.4%
- Johnson & Johnson (JNJ): -9.7%
- Microsoft (MSFT): -8.5%
- UnitedHealth (UNH): -7.5%
- Procter & Gamble (PG): -5.1%
- Walmart (WMT): -5.1%
- Facebook (FB): -4.5%
- JPMorgan (JPM): -4.2%
- Alphabet (GOOGL): -0.01%
What’s most interesting about the above is that some of the market’s leaders have transformed into market laggards: AAPL, AMZN, TSLA and NVDA are all down more than 10% since mid-October.
Oddly, Alphabet (GOOGL) has bucked the broader “big tech” trend and is basically flat over that period—a situation that’s been widely attributed to favorable Q3 earnings.
Regardless, the above clearly illustrates that many big-cap stocks have experienced corrections of more than 5% since Oct. 12. That’s an important threshold because previous research conducted by tastytrade revealed that selling puts in so-called “blue chip” stocks that have corrected by 5% (or more) has historically produced attractive win rates.
In the markets, the term “blue chip” typically refers to publicly traded companies with large market capitalizations (in the trillions or hundreds of billions) that also enjoy widespread name recognition.
While there aren’t precise guidelines for identifying “blue chips,” the 30 companies included in the Dow Jones Industrial Average (DJIA) are usually associated with this naming convention. Other large, high-quality companies that have long track records of success are also commonly referred to as “blue chips” (i.e. the companies listed in the bullet points above).
Consensus opinion suggests the term “blue chip” in the financial markets originally derived from 19th century poker sets, which often designated blue-colored chips as the most valuable (where white = $1, red = $5 and blue = $25).
Blue chips attract stock and options traders—especially premium sellers—because the risk of bankruptcy in these companies is usually lower, relatively speaking, than other companies operating in the same sector. Blue chips are also more likely to have weathered multiple economic downturns such as the one playing out now.
A past installment of Market Measures shined the spotlight on blue chips and investigated whether significant pullbacks in such stocks opened relatively more attractive windows of opportunity for selling premium.
In order to analyze this hypothesis, the Market Measures team designed a historical market study featuring a side-by-side comparison of two different blue chip trading approaches: selling puts in blue chips across all market environments (i.e. the control group) and selling puts in blue chips only after a pullback of 5% or more.
The results of the study were compelling.
For further context, the market study included the following parameters:
- Utilized data from 2005 to 2016
- Incorporated several large-cap holdings (MMM, GS, IBM, and UNH)
- Sold options with on average 45 days-to-expiration (DTE)
- Managed trades at 50% of max P/L
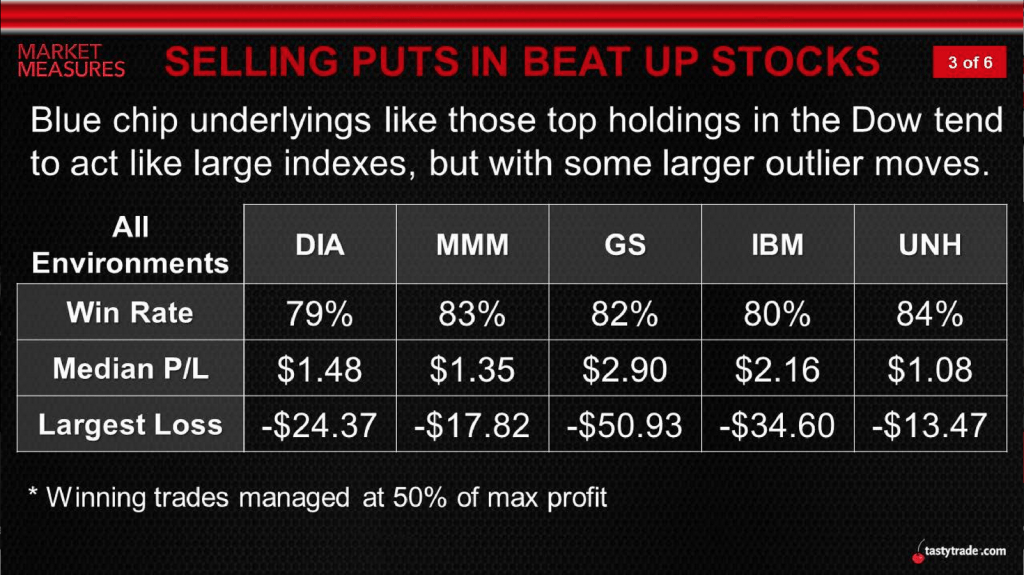
As one can see in the summarized findings below, the short puts sold in blue chips after pullbacks of more than 5% demonstrated superior performance. However, the “all environments” approach worked quite well, too. The first image below highlights the “all environments” data, while the second image summarizes the performance of short puts after a 5% pullback.
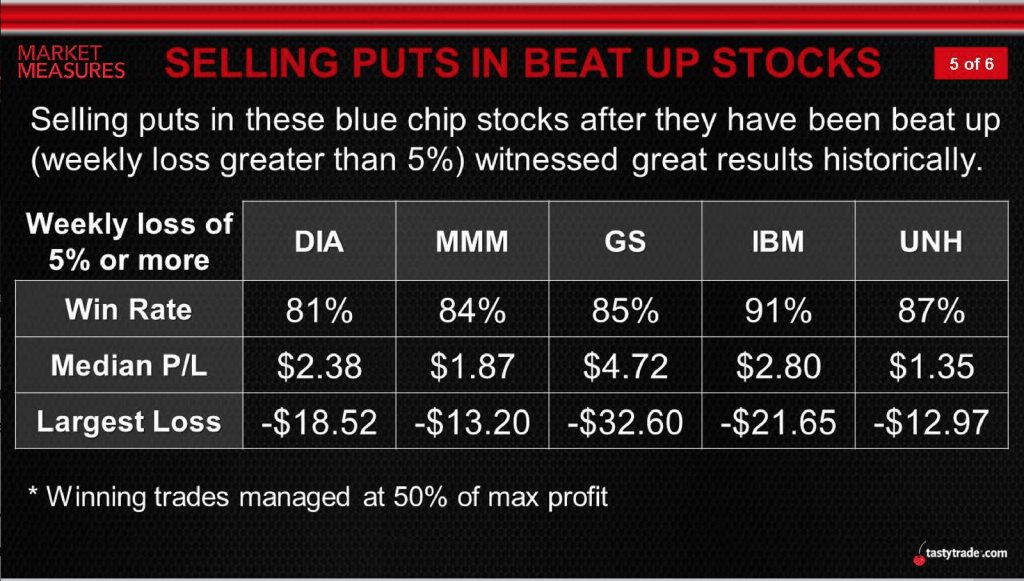
As seen in the second graphic, both the win rate and the median P/L jumped when using the 5% pullback as a trading indicator (as compared with all environments). Moreover, that approach also helped minimize exposure to large losses.
For example, in 3M (MMM), when selling puts across all environments, the median P/L was $1.35 with the largest loss being -$17.82. But when limiting trades to only after a large down move (5% or more), the median P/L improved to $1.87, while the largest loss decreased to -$13.20.
Results from each of the other four symbols in the study showed a similar trend.
To review this market study in greater detail, readers are encouraged to watch the complete episode of Market Measures focusing on blue chip put sales when timing allows.
Readers may also want to note that after reporting earnings on Oct. 26, the stock of European software giant SAP (SAP) suffered a pullback of almost 23%—well beyond the 5% threshold and also much deeper than the pullbacks observed in the majority of “big tech.”
While short puts in blue chips may not fit everyone’s outlook and/or risk profile, it’s possible that the concepts discussed in this episode may help identify other long/short opportunities in the markets.
To learn more about trading equity options—and specifically volatility—readers are encouraged to review another recent Luckbox post.
Sage Anderson is a pseudonym. The contributor has an extensive background in trading equity derivatives and managing volatility-based portfolios as a former prop trading firm employee. The contributor is not an employee of Luckbox, tastytrade or any affiliated companies. Readers can direct questions about any of the topics covered in this blog post, or any other trading-related subject, to support@luckboxmagazine.com.