Short Volatility and the Short Delta Bias
The S&P 500 is now roughly twice as high as it was before the correction observed during the Great Recession.
In the spring of 2007, the S&P 500 briefly flirted with levels above 1,500. As of November 2019, the S&P 500 is well above 3,000.
Talk about a bull run.
This is now the longest bull run in history if one considers the time elapsed between start and finish. Given that it hasn’t “finished” yet, the current bull run continues to add to its record length on a daily basis.
The absolute level in the S&P 500 is certainly not a reason on its own to initiate a short directional delta bias. However, the current record highs in the S&P 500 do provide important context for just how significantly equity indices have rallied since the depths of 2008-2009.
Looking at the VIX, a measurement of volatility in the options of the S&P 500, the current level of 12 and some change isn’t the lowest level observed in history, but it’s not far from it, either. The lowest ever close in the VIX was 9.19 and was recorded on Oct. 5, 2017. For reference, the highest ever close in VIX history was 80.86 on Nov. 20, 2008—during the zenith of the Financial Crisis.
Putting two and two together from this historical data, it’s fairly easy to extrapolate what many traders have already well known—the S&P 500 and the VIX share a unique bond, one that historically presents itself in the form of a strong inverse correlation.
2019 has provided a sharp reminder of this relationship, with the VIX rallying pretty much only when the S&P is declining. And as one can see from the current readings, complacency appears to be the current watchword, with the S&P 500 rallying to new record highs and the VIX continuing to drag along the bottom of its historical range.
What’s a trader to make of all this?
That somewhat depends on one’s trading approach and risk profile.
However, the current market landscape does serve as a good reminder as to why short premium traders often prefer to lean the net delta in their portfolios short. The reasoning behind this tendency is illustrated in the slide below. As equities correct, implied volatility tends to rise.
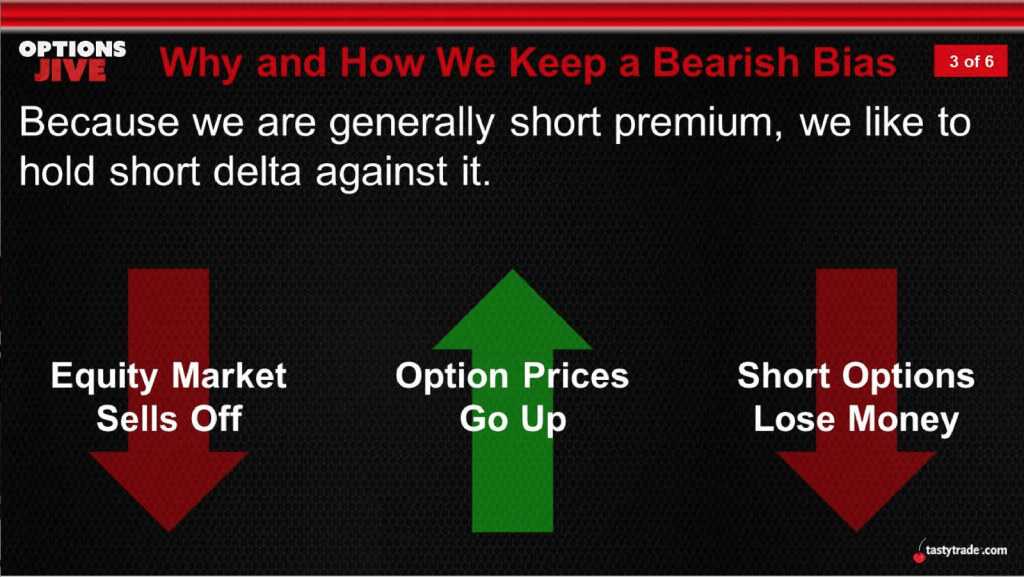
The above helps reinforce why short premium traders prefer the short delta bias—because that particular positioning allows the short delta component to help offset losses associated with rising implied volatility during a correction.
The power of a short delta was illustrated clearly in an example outlined on a previous episode of Options Jive on the tastytrade financial network.
On the show, the hosts walk viewers through an example that includes a range of outcomes when equity prices fall and implied volatility rises. All the assumptions in the example remain static, except for the net delta bias.
Referring to that example, imagine a hypothetical portfolio with net vega exposure of negative 100. Now imagine that the related underlying price goes down $2 while implied volatility rises by one full point—certainly a plausible situation.
The chart below illustrates the P/L impact on the position given the above hypothetical scenario. It also breaks down the results into three groups by tweaking the net delta of the portfolio (short delta, neutral delta, positive delta):
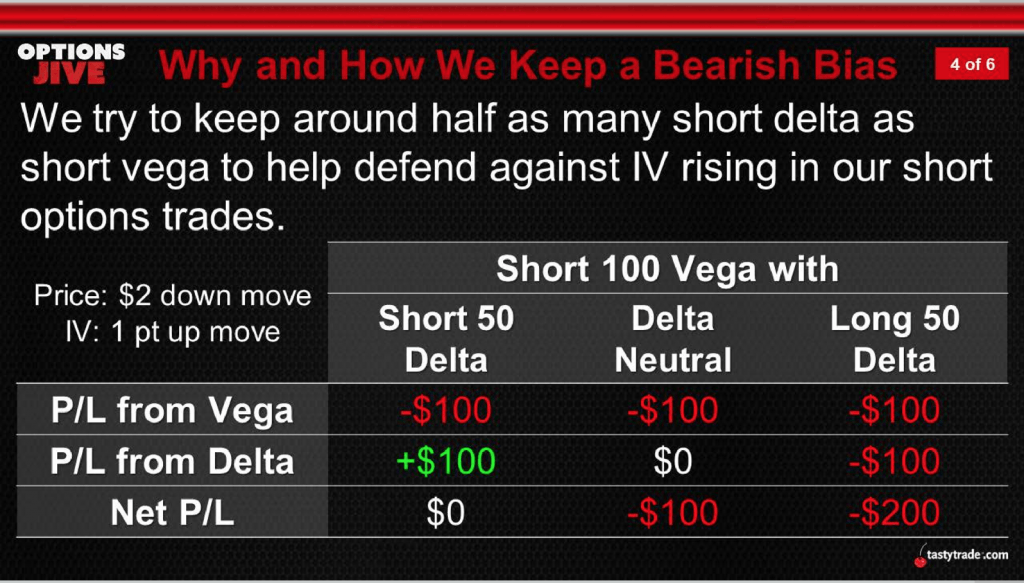
As one can see in the above data, when paired with a net long delta bias, the short premium (short volatility) strategy suffers when the market drops and volatility picks up. In this case, the net P/L is -$200 because the portfolio loses on both vega and delta (-$100 each).
Now compare this to the case in which the portfolio is short vega, but also net short delta against it. In this case, the portfolio breaks even when the underlying price drops and volatility rises—which is a much preferred alternative (in terms of P/L) compared to the long delta or neutral delta scenarios.
Depending on your own unique trading approach and risk profile, a directional bias may or may not be the appropriate course of action going forward. However, this exercise does help illustrate the risks associated with delta and serves as an important reminder that delta decisions (at the position and portfolio level) should be fully understood prior to trade deployment.
As the example demonstrates, mismanagement of delta in the portfolio can have a big impact on expected P/L. Traders seeking additional information on short volatility and the short delta bias may want to review the complete episode of Options Jive when scheduling allows. A new episode of Trade Logic Unlocked focusing on this same topic is also recommended.
Sage Anderson is a pseudonym. The contributor has an extensive background in trading equity derivatives and managing volatility-based portfolios as a former prop trading firm employee. The contributor is not an employee of luckbox, tastytrade or any affiliated companies. Readers can direct questions about topics covered in this blog post, or any other trading-related subject, to support@luckboxmagazine.com.