The Equity Index Pairs Trade
For pairs traders that are filtering for potential signals in the market, the current trading relationship between the S&P 500 (/ES) and the Nasdaq (/NQ) may be worth a closer look.
Pairs in this case refers to the trading approach often taken when a strong correlation between two underlyings breaks down temporarily, allowing for an opportunity to deploy a two-pronged position which seeks to capitalize upon a return to “normalcy.”
With directional pairs such as this, the most important initial requirement is not only that both pairs are liquid, but also that a strong historical correlation exists between the two. It’s this correlation that provides the foundation for the trade, because without that one would simply be trading a 50-50 shot in the dark—or worse: two 50-50 shots.
Equity indices are frequently at the top of the list of many directional pairs traders because there exists a strong, established, historical correlation between the likes of the S&P 500, the Nasdaq, the Russell 2000, and the Dow Jones.
This reality is clearly illustrated in the graphic below:
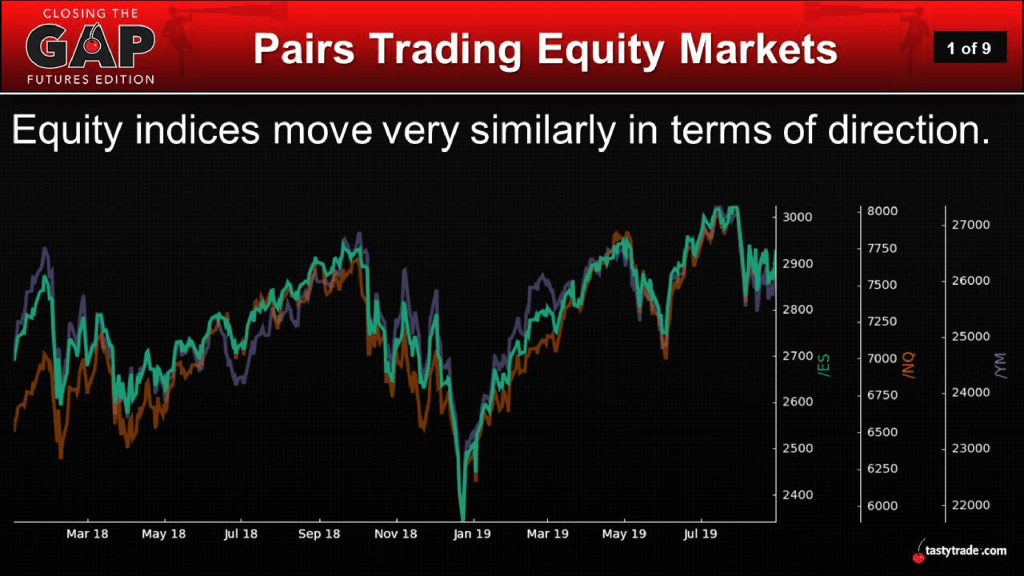
Strong correlations are clearly exhibited in the chart above, but one can zoom in on different points in history and find that there are instances when these correlations do break down.
And while traders often talk about “reversion” in terms of implied volatility, this concept is also applicable to price relationships. In these instances, reversion refers to a return to the “normal” trading relationship from an “abnormal” state.
At the end of 2018, when equity markets were whipsawing, correlations between the four major U.S. indices was extremely high—as is common during extended selloffs. However, in 2019, the correlations have broken down several times, and windows of opportunity have appeared.
Currently, a breakdown appears to have materialized in the form of the Nasdaq (/NQ) outpacing the S&P 500 (/ES), as indicated in the data below:
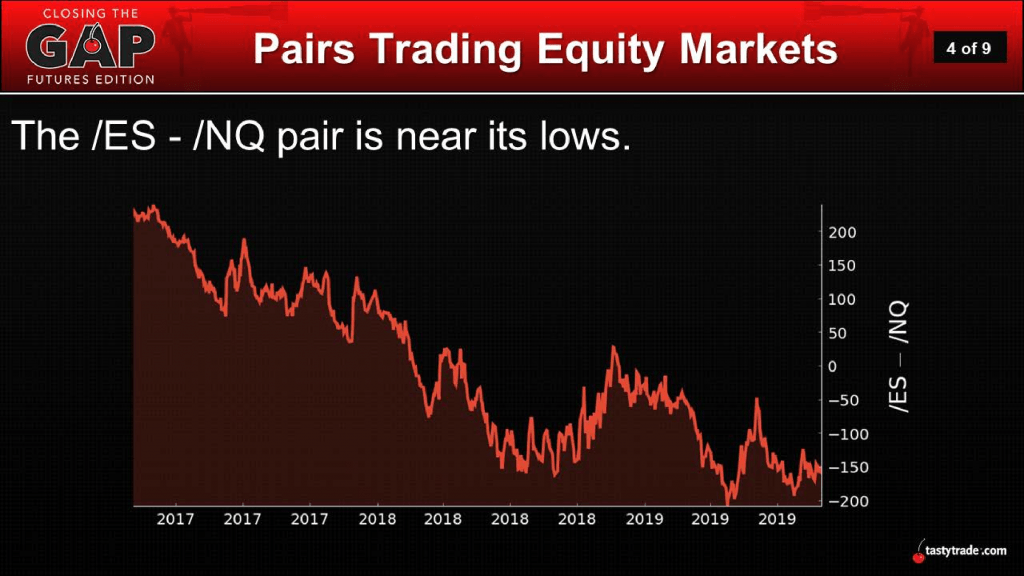
While traders often measure breakdowns in correlations using ratios such as the Gold-Silver Ratio, there are other methods of measuring such occurrences.
In the case of the above chart, the hosts of Closing the Gap: Futures Edition on the tastytrade financial network introduce how another simple formula can be used to identify breakdowns in correlations—particularly in the case of equity indices. For example, the above chart highlights how the net difference between the S&P 500 (/ES) and Nasdaq (/NQ) can be used to ascertain the current state of the correlation dynamic. However, there is one wrinkle to the calculation.
As pointed out by tastytrade’s resident futures expert Pete Mulmat, sizing down slightly in the Nasdaq helps to ensure that the pairs are appropriately scaled. According to current prices in the market, he finds that 0.40 of the Nasdaq lines up well.
Using the current values of approximately 2,933 in /ES and 7,962 in /NQ means the difference comes out to be roughly -267 [3,000 – (8,169 x 0.40) = -267]. Referring back to the chart, which shows how this relationship has changed over time, one can see that -267 represents a “price extreme” based on the historical difference between the S&P 500 and 0.40 of the Nasdaq, which means the current value represents an extreme point in the recent historical range.
As a reminder, a pairs trade involves taking opposing positions in two different markets (i.e. two different underlying symbols/assets), but typically of the same expiration/duration. In the case of futures, that would mean two different symbols (/ES and/NQ), but the same expiration month for both.

In this regard, pairs trades remove the need for taking so-called “naked” (i.e. concentrated directional risk in a single underlying/market/asset).
Instead, pairs trades hinge on opposing directional bets in two different underlying products that share an established, long-term correlation. That means risk is theoretically reduced, because the historical relationship between the two provides some degree of confidence that they will at some point return to their normal trading behavior.
Referring once again to the chart above, we can see that the current mark of -267 does indicate that /ES and /NQ are currently trading at a point that many pairs traders might view as attractive. Based on current conditions, a pairs trader might consider getting long the S&P 500 (/ES0 versus getting short the Nasdaq (/NQ).
The basis for this pairs trade would be an expectation that the two would eventually revert to their “normal” behavior. Theoretically, this position benefits as the S&P 500 rises, or the Nasdaq drops, or both. That in turn would involve the current difference of -267 getting less negative, or even moving into positive territory.
Playing out some “what if” scenarios, it’s easy to see how the risks inherent in this trade are reduced as compared to a naked bet in one index or the other.
For example, if you wanted to short the Nasdaq as a stand-alone position, it would be exposed to substantial upside risk in /NQ. By layering in the second leg of the pair (long S&P 500), a natural hedge is provided in the event of an outsized move.
Traders interested in learning more about pairs trades will undoubtedly benefit from a review of the complete episode of Closing the Gap: Futures Edition focusing on the current “price extreme” in the S&P 500 and Nasdaq.
Sage Anderson is a pseudonym. The contributor has an extensive background in trading equity derivatives and managing volatility-based portfolios as a former prop trading firm employee. The contributor is not an employee of luckbox, tastytrade or any affiliated companies. Readers can direct questions about any of the topics covered in this blog post, or any other trading-related subject, to support@luckboxmagazine.com. Additional information is also available in the tastytrade LEARN CENTER.
