Insiders Call a Bottom
When executives buy and sell their company’s stock, that’s a consistently reliable indicator of future prices. Recently, insider activity signaled a market bottom—at least before Vladimir Putin and the Fed arrived.
ake notice when C-level execs acquire or unload stock in their companies. They may be telling investors something about the direction prices will soon be heading.
The history of the insider buying-to-selling ratio indicates a pattern of corporate executives calling a bottom on market downturns. When a stock bottoms, it has reached its low point and may be about to ascend.
Don’t believe it?
Let’s turn to GuruFocus, an online financial news and research platform.
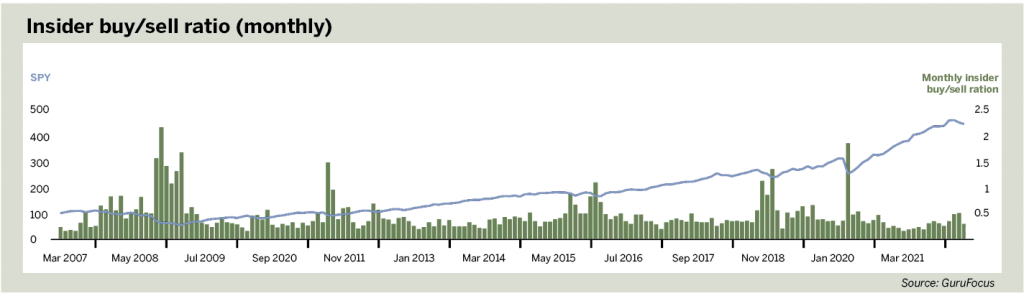
Insider buy/sell ratio, below provides a monthly breakdown of when the number of buyers outpaced the number of sellers (the ratio). When the number of buyers outpaces the number of sellers, the ratio is above 1. When the number of sellers outpaces the number of buyers, the ratio is less than 1.
At the height of the 2008 financial crisis, insiders called a bottom on their stocks over October 2008 through March 2009.
When the Federal Reserve stepped in with Operation Twist, and Congress executed a significant stimulus package under the Obama administration, markets started their turnaround on March 6, 2009.
But it doesn’t stop there.
A surging insider buy-to-sell ratio accompanied short-term bottoms over the last decade. Insiders ramped up buying during the debt ceiling jitters and Black Monday of 2011.
Buyers also stepped up in late 2015 after China sent a wave of panic across the markets (alongside falling oil prices and Greek debt woes).
Something similar happened in 2018 after a significant selloff occurred because of factors that included the “Chinese tariff” tantrum, expectations of interest rate hikes and speculation about regulatory matters.
The most significant insider buying spree since the Great Financial Crisis took place in March 2020 after COVID-19 fears nearly shut down the U.S. economy and the S&P 500 shed roughly 34% of its value in a matter of weeks.
Insider buying also ramped up over two weeks as the Federal Reserve announced an unprecedented amount of monetary stimulus to combat the pandemic’s effects on the economy.
Once again, insider buying signaled a bottom in the market, reminding investors that no one knows the balance sheets and the value of corporate assets better than chief executive officers, chief financial officers, board members and other executives who scoop up their own shares on the cheap.
It also helps when the Fed plays ball.
History repeats itself?
Executives might sell their stock for any number of reasons.
A CEO might sell a few million dollars in stock in the belief that it’s heading lower but might just want cash to buy a new vacation property or send a child to school. One sale doesn’t provide many clues about sentiment.
But a large amount of selling by multiple executives—a process called “cluster selling”—could indicate corporate insiders think the stock is overvalued compared with where it might be in a few months.
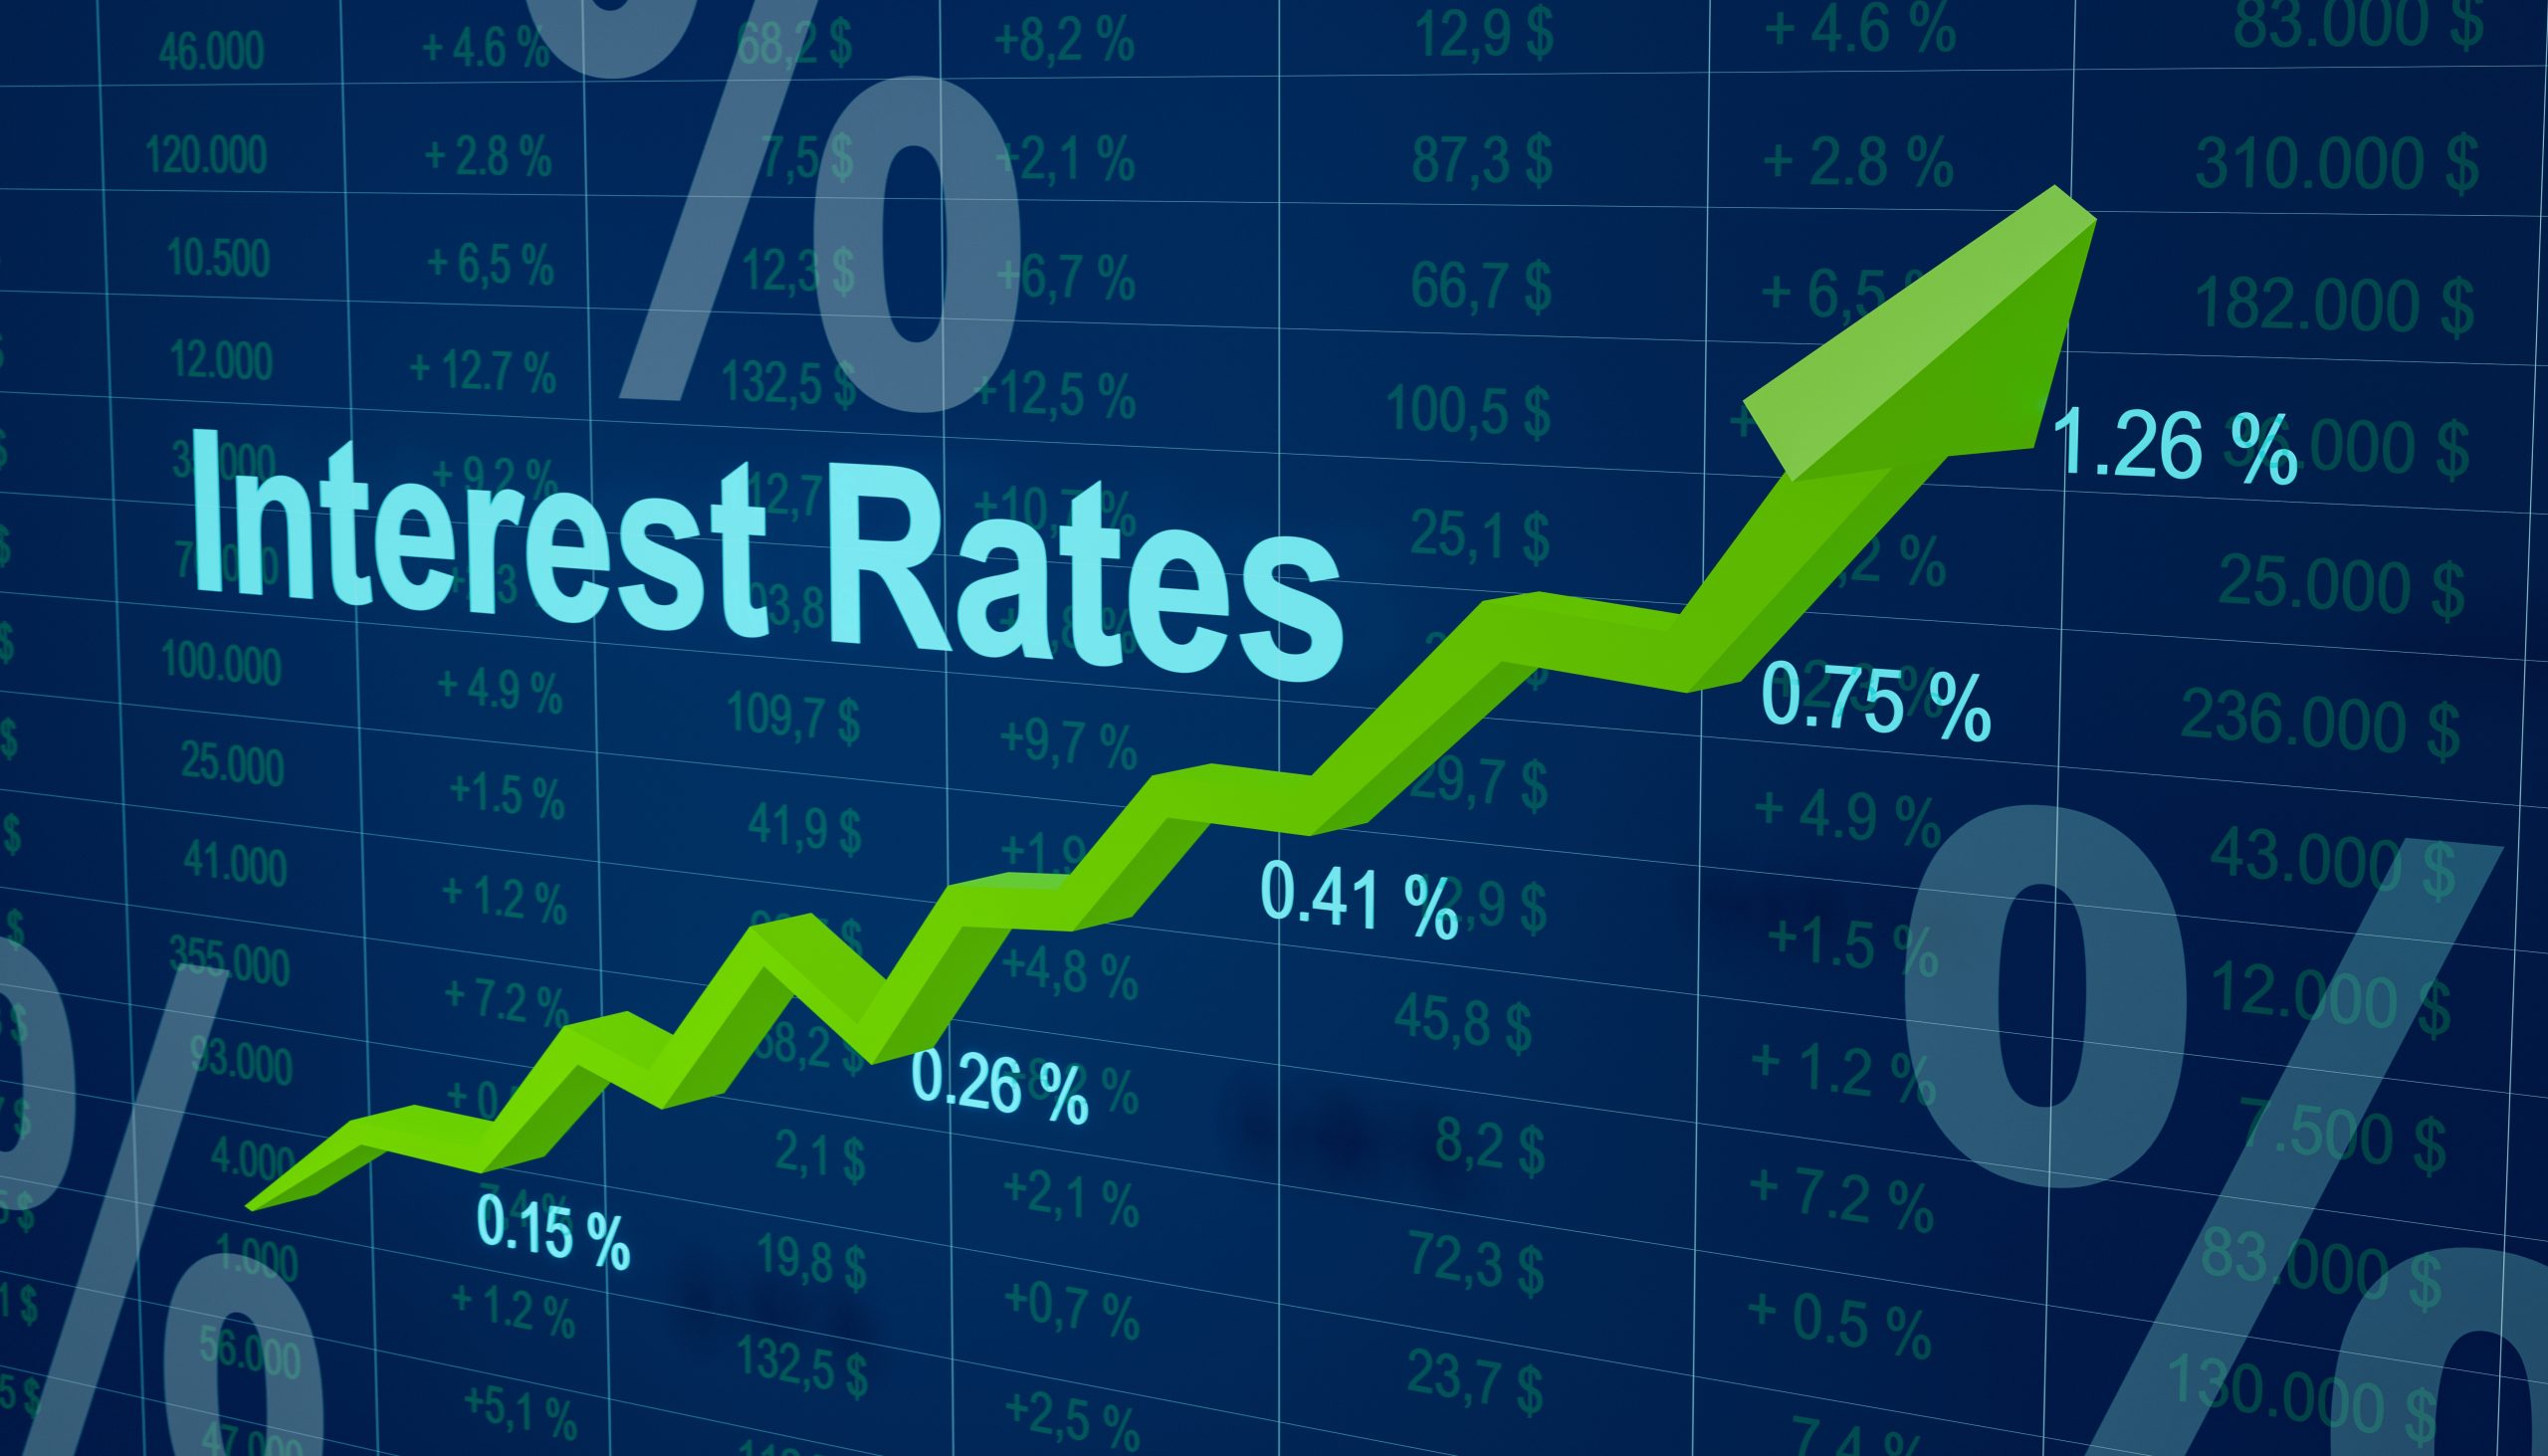
In mid-2021, interest rates remained at zero, alongside low expectations that the Fed would raise interest rates by March 2022. However, as sentiment for rate hikes slowly increased, insider selling increased significantly.
In the first 11 months of 2021, CEOs and other insiders sold $69 billion in stock, according to InsiderScore/Verity. That figure was 79% above a 10-year average and clearly signaled that executives were happy to take money off the table.
Since November, the sell-off across the markets has fueled speculation regarding when a bottom would form. In locating a bottom, the most readily apparent predictor would be the amount of buying and selling.
Following a dismal selloff during January expiration week, many traders kept a close eye on whether insiders would embark upon a big round of buying.
Sure enough, a pattern of solid buying revealed itself during the final week of the month.
Moving average
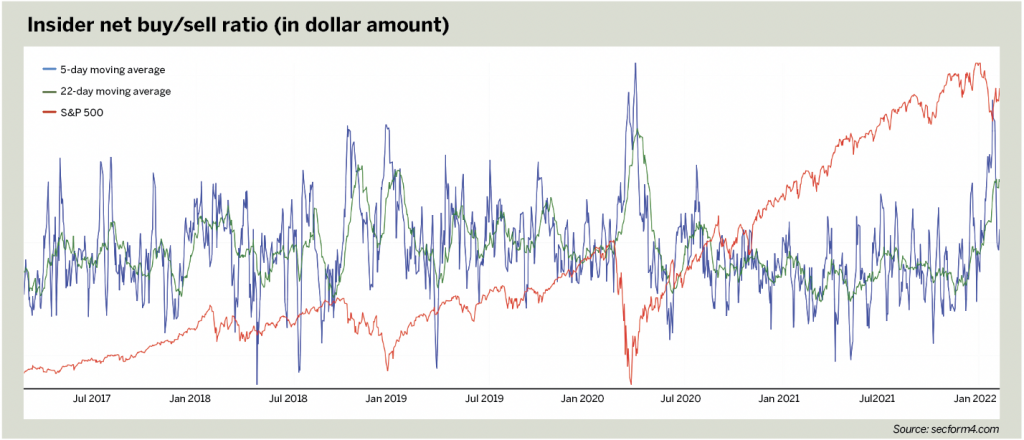
The chart Insider net buy/sell ratio, below, from secform4.com tracks insider buying and selling, and shows its five-day moving average during the period.
The blue line reveals that following that dramatic January sell-off, the five-day moving average of insider buying to selling in terms of dollar amount hit its highest level since March 2020.
The January wave of insider buying signaled a bottom alongside various other metrics like aggregate momentum of oversold exchange-traded funds.
This might not predict a complete bottom of the market—as evidenced during the 2008 crisis and a number of months of strong buying.
However, that buying pattern did provide some stabilization—
at least until February when James Bullard, president of the St. Louis Federal Reserve, called for speeding up interest rate hikes and
Russian President Vladimir Putin invaded Ukraine.
Should those tensions and Fed jitters push the market lower, traders should continue to monitor the five-day moving average of this metric in times of high volatility and consider this question when the market sells off: Are we at the bottom yet?
To find out, one must listen to the insiders.