Big Fed Decision Looms; Opportunities Multiply
Given the dramatic movement in bond prices and interest rates so far in 2019, traders of futures and associated options have certainly enjoyed a rich opportunity.
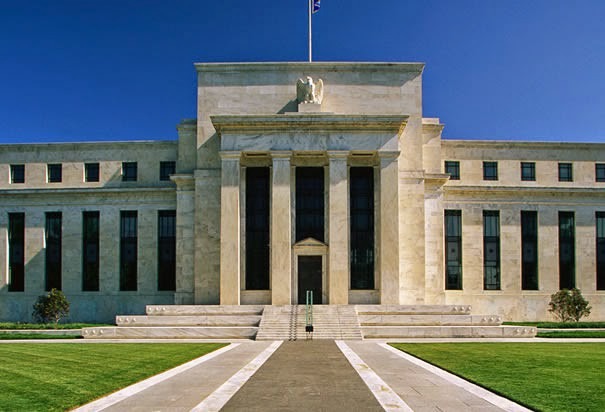
And as of right now, it doesn’t look like the drama will be ending anytime soon—especially with another important meeting of the Federal Reserve set to take place on July 30-31.
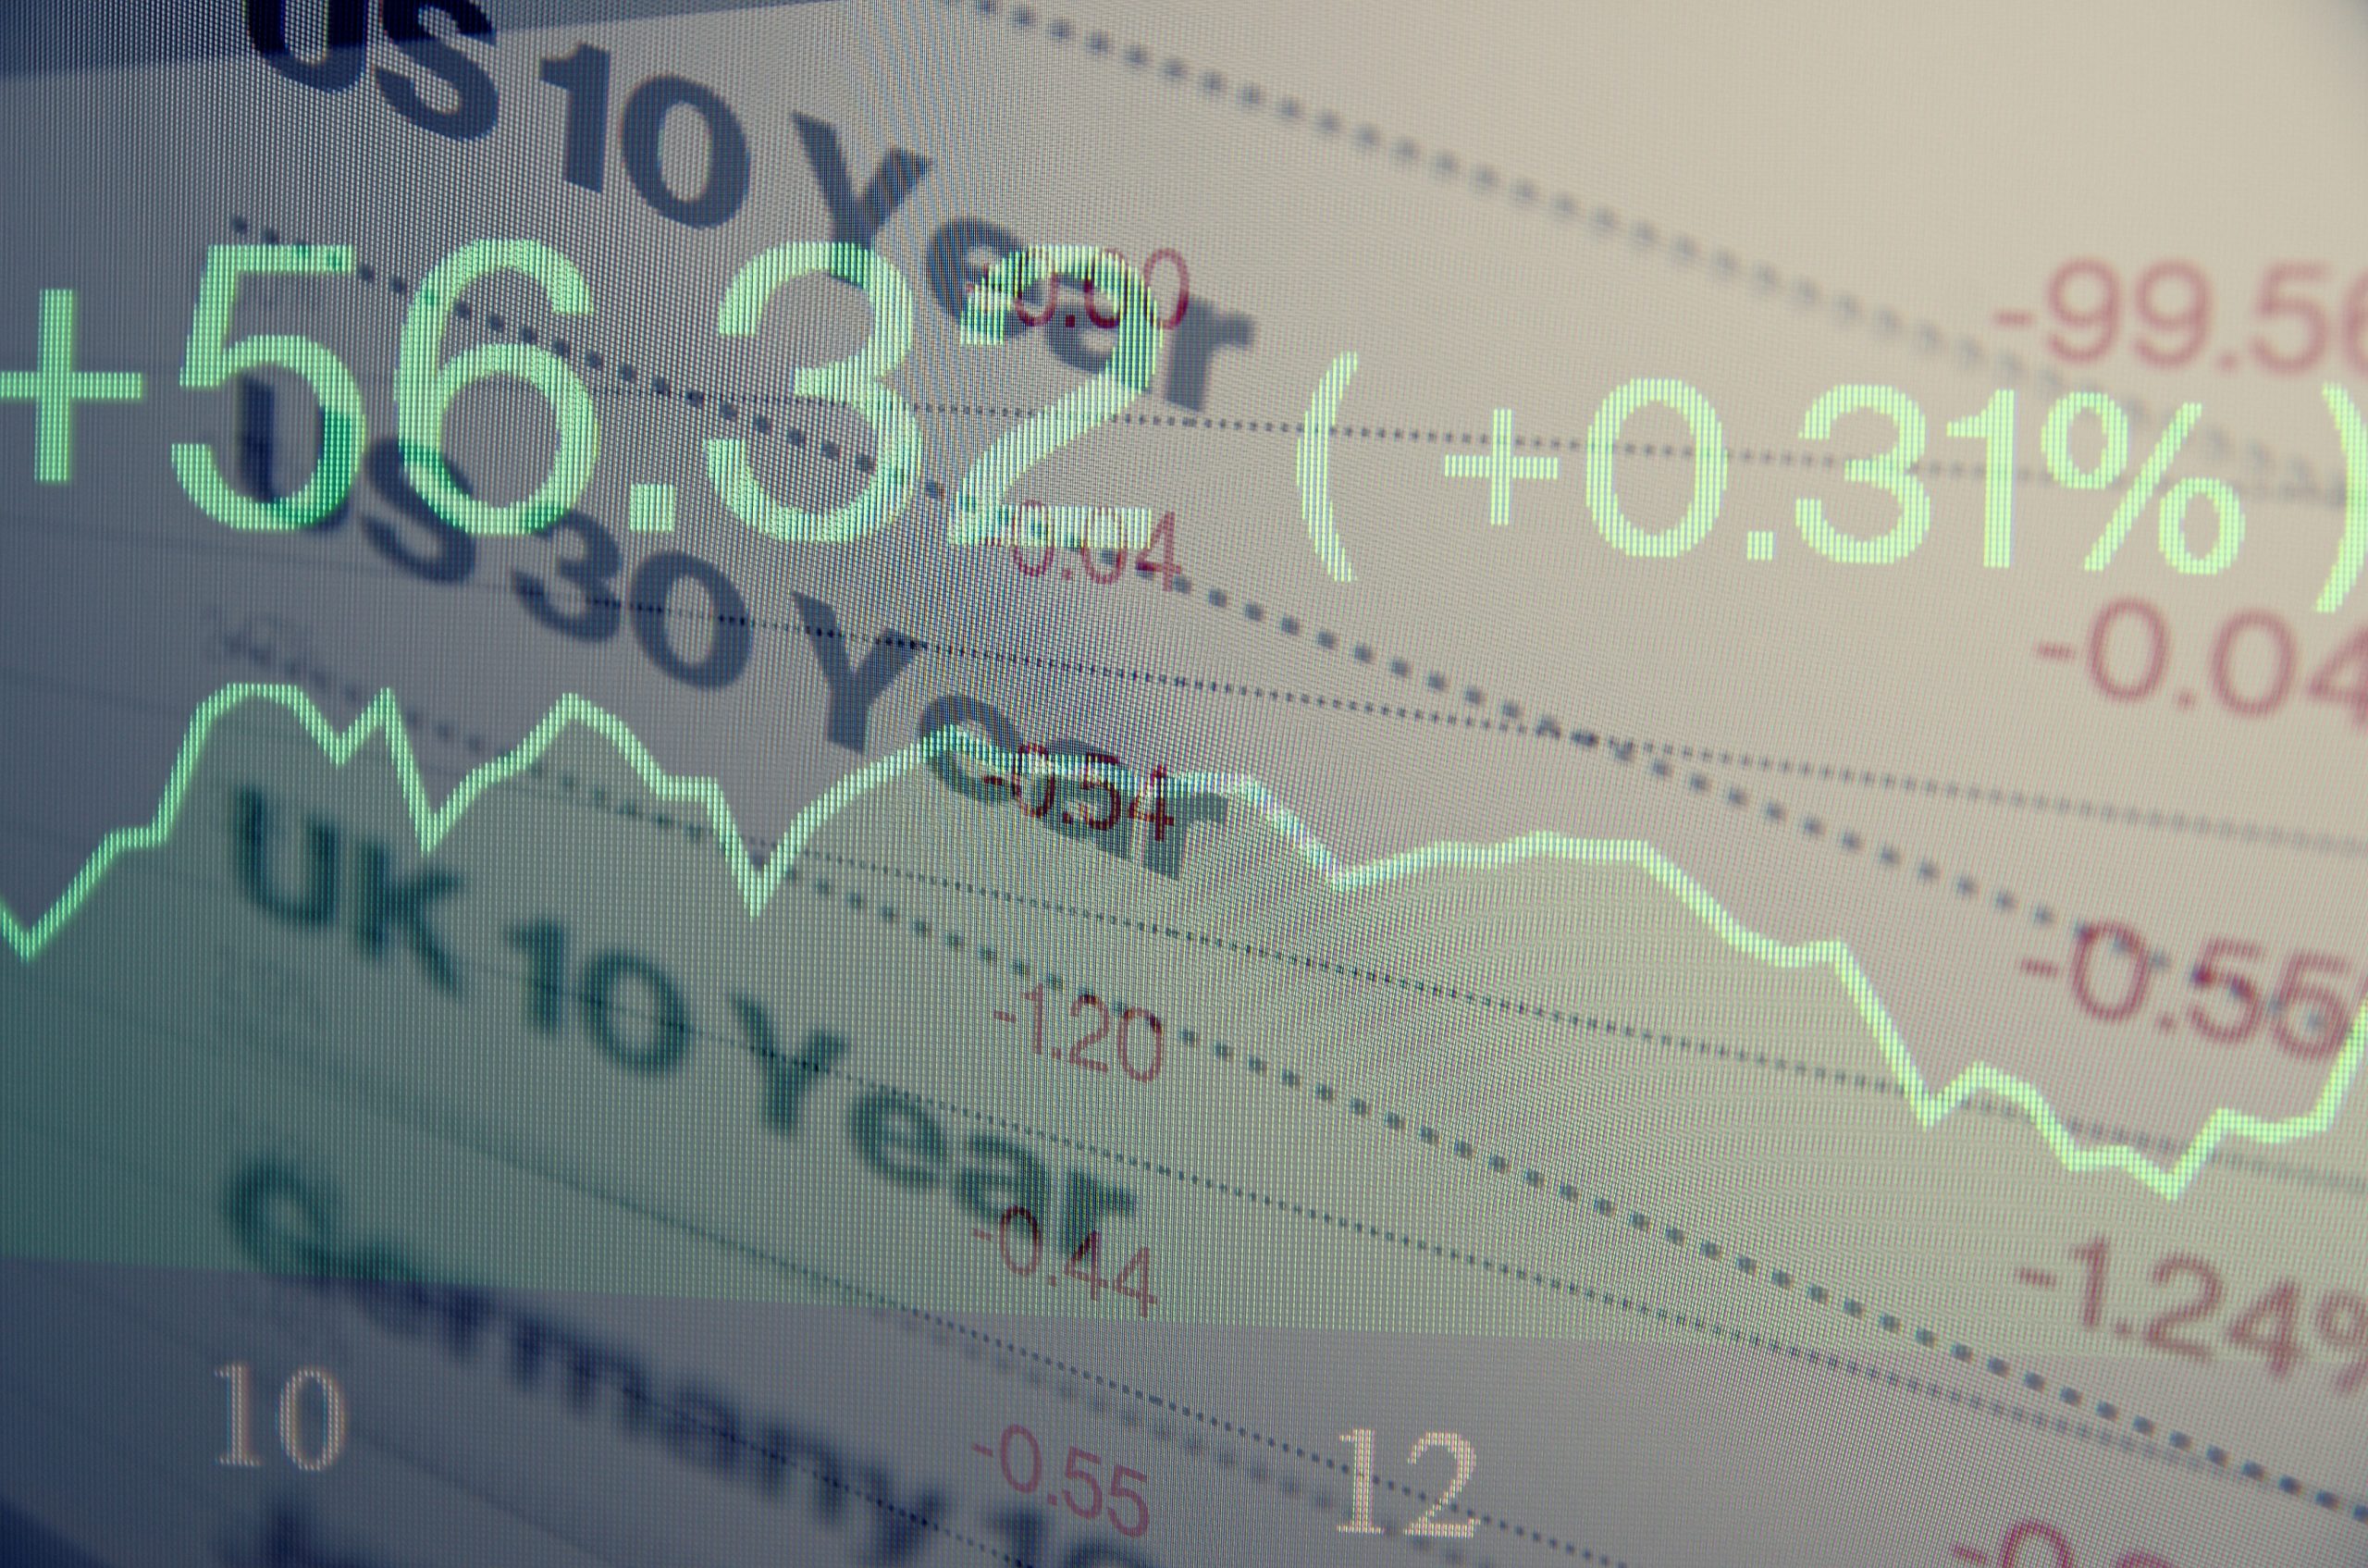
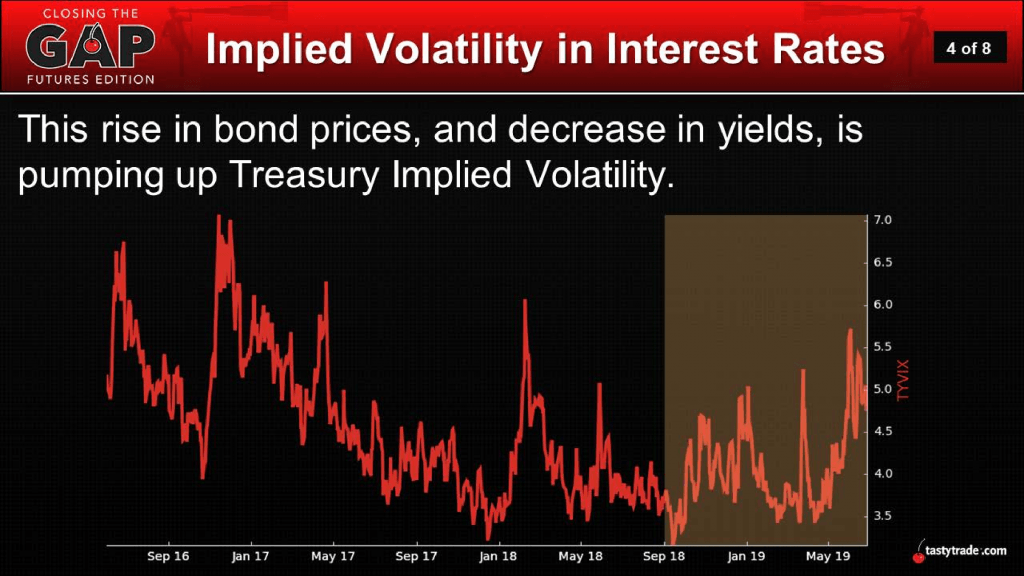
Investors looking for insight into just how wild the ride has been so far, need look no further than the implied volatility of Treasuries, which recently reached peaks not seen since the start of 2018.
As a reminder, interest rates and bond prices (such as Treasury Bonds) share a strong inverse correlation. When interest rates decline, bond prices typically rally, and vice versa. Additional information on this strong, long-running relationship is available in a piece published by the tastytrade financial network titled “Your Guide to Interest Rate Futures.”
Because of growing expectations for a slowdown in the U.S. economy, long-term interest rates have declined steadily this year, which has catalyzed an expected pop in bond prices. These trends are illustrated in the two graphics shown below:
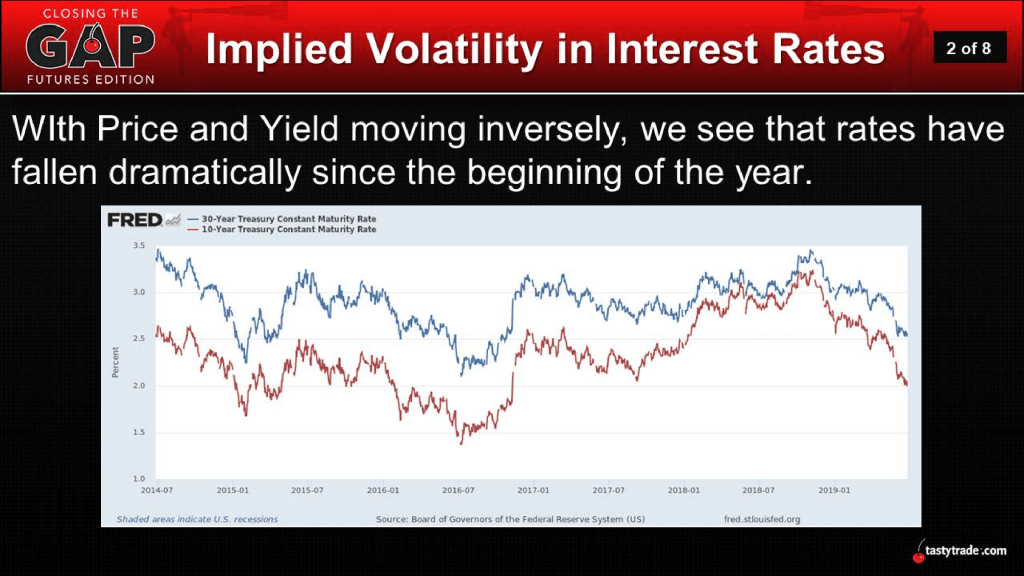
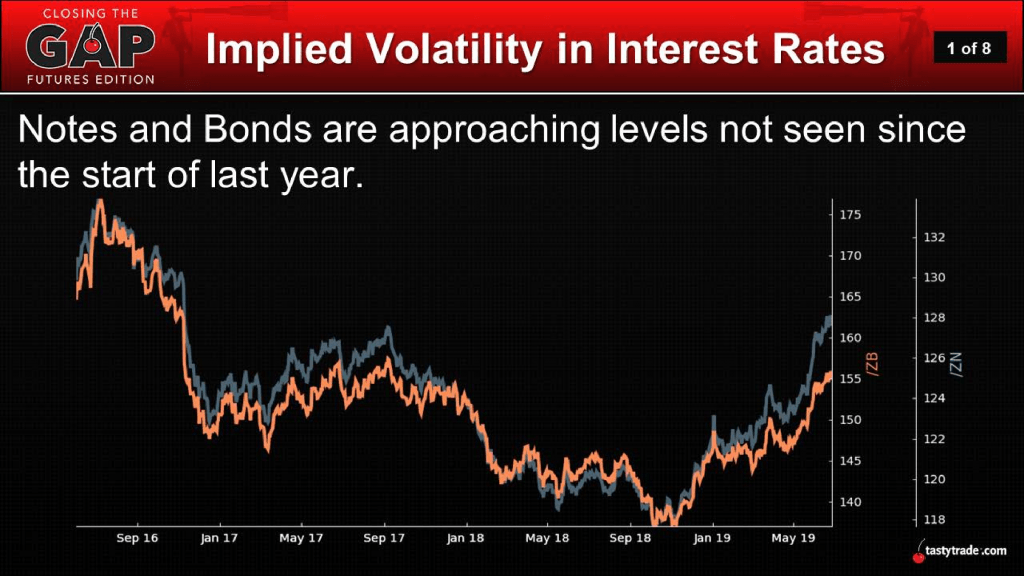
In the first graphic above, interest rates have shown a steady decline in this year. The second chart shows how Treasury Bonds and Treasury Notes have responded by rallying higher.
But there’s another dimension to the interest rate environment that also can’t be ignored, and that’s an increase in implied volatility for the options of treasury futures. This wrinkle means that market participants have an additional avenue they can consider when trading rates—volatility.
While many associate volatility trading with equities and ETFs, this methodology can also be applied to futures options.
Futures options operate much the same as equity options, except for the major difference that future options derive their price from the underlying futures market they are associated with, while equity options obviously derive their value from an underlying equity.
To learn more about options on futures, traders can review a piece called “Introducing Options on Futures.”
Similar to equity options, futures traders can monitor levels of implied volatility in futures options for potential “mean reversion” opportunities. In the world of equity options, volatility traders often look for instances where implied volatility is trading at an extreme, and then purchase or sell premium with the intent of profiting from a “reversion to the mean.”
For example, if stock XYZ had traded with an implied volatility range of between 20 and 40 over the last 52 weeks, a trader might consider selling volatility when implied volatility rises to 40 (or above). On the other hand, a trader might instead consider purchasing volatility when it drops to 20 (or below).
One metric traders can use to monitor ongoing levels of implied volatility in both equities and futures options is Implied Volatility Rank (aka: IV Rank or IVR). IV Rank compares the current levels of implied volatility to the previous 52 weeks of data, and provides insight into whether implied volatility is cheap, fair or expensive based on recent history.
For example, if implied volatility in hypothetical stock ABC had ranged between 40 and 60 over the last 52 weeks, then IV Rank for ABC would be 100% if implied volatility was currently trading at 60. If implied volatility dropped to 40, then IV Rank would drop to zero.
When IV Rank is above 50% in a given underlying, volatility traders often consider selling options premium, and when it’s below 50%, they might consider potentially purchasing options premium. The hope with such a trade is that low volatility reverts higher toward its mean, and that high volatility reverts lower toward the mean – resulting in a profit for the long/short volatility trader.
In a recent edition of Closing the Gap: Futures Edition on the tastytrade financial network, the hosts outline how this same methodology can be applied to options in the futures universe. On the show, a hypothetical example is used to help illustrate how this approach can be applied in the market.
This type of trading approach is particularly relevant at this time because implied volatility in interest rate-sensitive products appears to be inflating heading into the July 30-31 meeting of the Federal Reserve, as shown below:
It’s widely anticipated that the Federal Reserve will cut interest rates by a quarter-point at their July meeting. While there are convincing arguments on both sides as to the appropriateness of a cut, the leaders of the central bank in the United States likely noticed that Stearns Holding filed for bankruptcy protection just after the July 4 holiday.
Stearns Holding is the parent of Stearns Lending, which is the nation’s 20th largest mortgage lender. Ominously, the last financial crisis in the United States also started when some of the country’s largest mortgage lenders started running into financial problems.
It’s hard to imagine that the recent Stearns Holdings news will have gone unnoticed by governors of the Federal Reserve.
With the July Fed meeting now looming large on the horizon, long-time traders of bonds and interest rates will most certainly be following developments related to US monetary policy extremely closely over the next several weeks (and likely beyond).
Traders looking to learn more about options on futures will find an extensive library of information available in the tastytrade LEARN CENTER.
Sage Anderson is a pseudonym. The contributor has an extensive background in trading equity derivatives and managing volatility-based portfolios as a former prop trading firm employee. The contributor is not an employee of luckbox, tastytrade or any affiliated companies. Readers can direct questions about any of the topics covered in this blog post, or any other trading-related subject, to support@luckboxmagazine.com.