Hey Volatility, What are you implying?
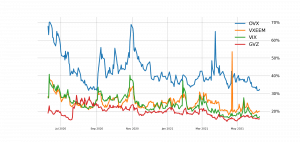
Implied Volatility readings across various liquid asset classes continue to deflate, generating much the same assumption that seems to be applied to the S&P 500-based VIX: ’“perhaps the summer doldrums have come early”. We have seen relative expected activity readings drop back to levels last seen before the pandemic. In the period preceding the dramatic tumble which began in earnest on February 24th, 2020, the benchmark index went six whole months with only a single day’s range-topping 2 percent of the previous session’s spot close. For risk-leaning assets like equities, oil, and emerging markets; the relationship between price action and implied volatility tends to be inverse – as the market rises, expected activity levels decrease. However, not all relationships are the same with gold’s own correlation tending to skew to the positive.
Given the broad correlation across the financial system around sentiment and volatility, when certain markets reflect a charge in expected activity while others hold relative reserve, it can highlight a deviation that will likely normalize. That can be a scenario where the low implied market catches up to the charged, but it is more often the opposite whereby the more active reverts to a broader moderation. Volatility is a mean-reverting and normalizing influence.