The High Probability of Low Standard Deviation Option Strategies
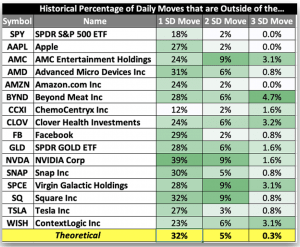
We wanted to see where the most theoretical opportunity for short-premium based strategies on the historical percentage of time that the stocks went “outside of the 1, 2 or 3 standard deviation 1-day movements.” We show the formulas below:
1 SD Move = Stock Price x IV x Sqrt(1/365)
2 SD Move = Stock Price x IV x Sqrt(1/365) x 2
3 SD Move = Stock Price x IV x Sqrt(1/365) x 3
These stocks are currently the most popular stocks on the tastyworks platform. The lower the number, the more the stock has stayed within the calculated movement. The higher the number the more frequent that the stock has moved OUTSIDE of the expected 1 day movement. In other words, historically, the higher the number the less likely a short premium strategy would have performed profitably.
Translations.
The “best” have been CCXI, AMZN and SPY since they have gone outside of the expected 1 standard deviation ranges the least over the past year.
NVDA, SQ, TSLA, FB and AMD have been among the most trouble.
BYND, SPCE and WISH have had some of the largest number of days with moves outside of the theoretical 3 standard deviation days.
The free weekly Cherry Picks newsletter from tastytrade is stuffed with market research studies, data-driven trade ideas, and unique insights from the geekiest of geeks. Conquer the market with confidence … get Cherry Picks today!
Cherry Picks is written in collaboration with Michael Rechenthin, PhD, Head of Data Science at tastytrade; James Blakeway, CEO of Quiet Foundation, a data science-driven subsidiary of tastytrade; and John Kicklighter, Chief Strategist at DailyFx with an expertise in fundamental analysis and market themes.