Trades

Where the Action Is
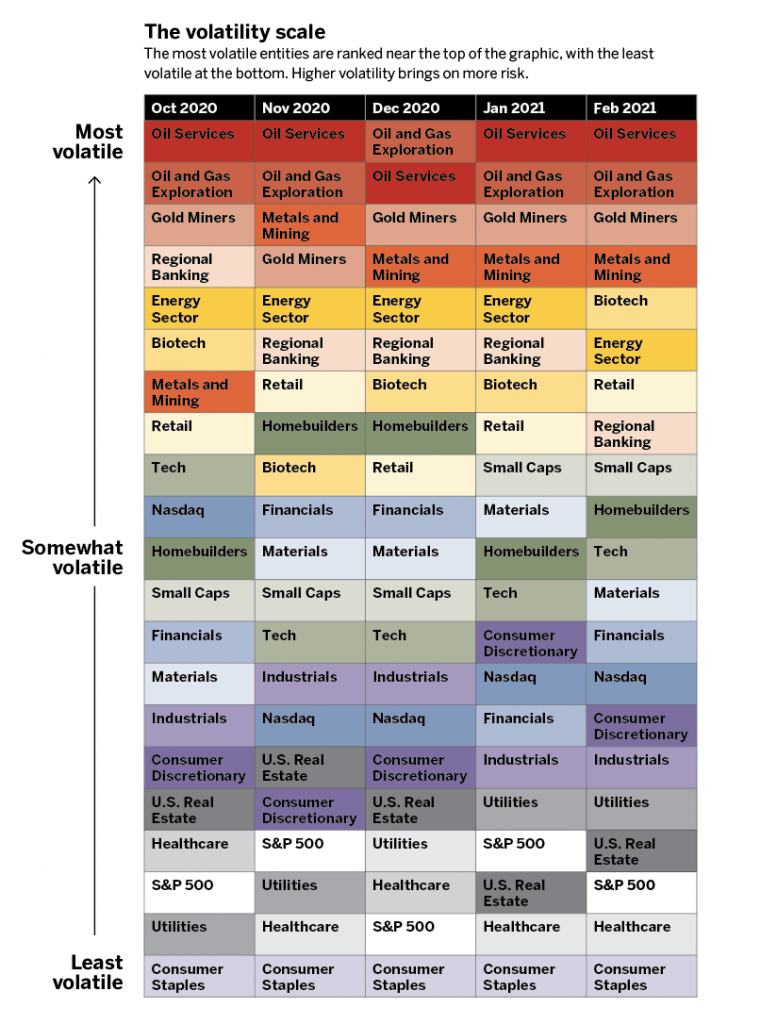
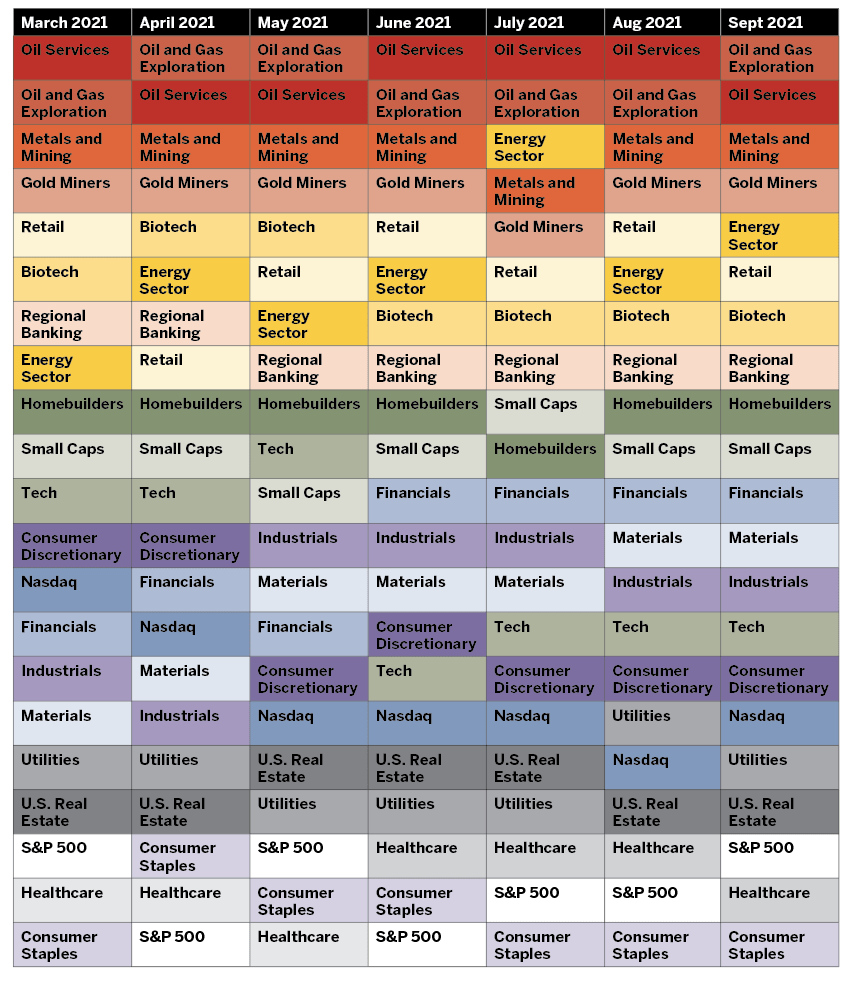
Understanding volatility helps traders manage risk. Here’s how sectors and indexes compare for their tendency to move in price.

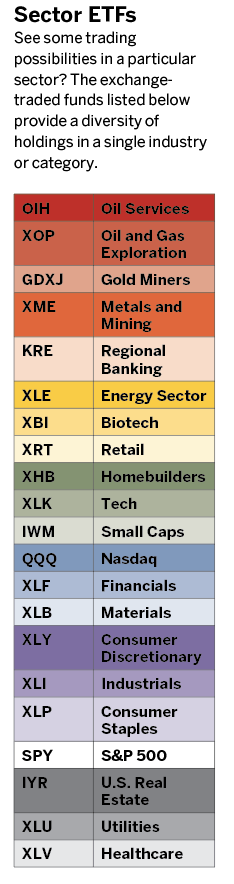
Volatility is synonymous with the probability of movement. Consistently volatile sectors, such as oil services (OIH), oil and gas exploration (XOP) and gold miners (GDXJ), have a high probability of movement.
Other sectors, including consumerstaples (XLP), utilities (XLU) and healthcare (XLV), have a lower probability of movement, meaning they’re more stable and thus more appropriate for investors who shy away from risk.
Of the major market indexes, small caps (IWM) tend to be more volatile than the Nasdaq (QQQ) and the S&P 500 (SPY).
Check out the following graphics to see the volatility of sectors and exchange-traded funds, or ETFs.
How can investors play sectors and indexes once they know the volatility involved? Check out the Sector ETFs listed on the opposite page for answers.


Sign up for free cherry picks and market insights at info.tastytrade.com/cherry-picks
Cherry Picks
-
6 Looks at Energy Stocks
|Crude oil prices of more than $100 a barrel are boosting stock prices in the petroleum sector, but the effect on the S&P 500 is limited because the commodity accounts… -
Futures Notional Values, the Crude Oil Curve and Current Index Skew
|Current Futures Notional Values Below are the current notional values for popular futures contracts. We also included their ETF approximate share equivalence, as well as their correlations to the ETFs.… -
Drawdowns, Data Sources and Trades Ideas
|What kind of drawdowns can be expected if you bought at the absolute worst time every month? Here are the 30-day drawdowns, over the past five years, of buying at… -
Backtest and Forward Test with Lookback
|See how a strategy performs before risking money on a trade Lookback, a free options analysis tool from tastytrade, provides two ways of examining the profit and loss around an… -
Correlations, Volatilities and Meta
|If you like X, you might also like A, B and C Take a look at the three most correlated stocks for every stock in the Nasdaq 100. We are… -
Historical Volatility and Implied Volatility
|Free Download – Historical Volatility and Implied Volatility In this morning’s Cherry Picks, we are providing a free download of approximately 1,100 stocks and ETFs along with their historical and… -
The One with All the Earnings
|Earning Season, Birds of a Feather Flock Together Earning Season “officially” begins with the big banks. See the graphic below that shows the number of sectors that report per day.… -
Yields, S&P Sector Performance and Earnings
|Yields on the Move With all the discussion of yields in the news lately, it is nice to see what’s moving. As seen on the graphic below, most of the… -
Seeking Diversity
|Rather than seeking to predict the next big thing, consider buying any of these 20 tickers to diversify a portfolio in the new year When all of the stocks and… -
What’s going on with the market?
|Take a look at the major indices (SPY, IWM, QQQ) and the equity sectors. Discretionary (XLY) is down the most over the past month, while Health Care (XLV), Real Estate… -
12 of the Most Boring Stocks
|Traders are not a monolithic group. Some have a high risk tolerance, while others are more risk averse. Those with higher risk tolerance would probably prefer to trade TSLA, while… -
Yields and Historical Volatilities
|Yields Below, check out the 2-, 5-,10-, 20-, and the 30-year Treasury yield to maturity. To see how the yields have changed, look at the different color lines. The 30-year… -
Sizing Futures and Holiday Movement
|Futures sizes? We got the hook up for you! Don’t trade without knowing the true size. That said, futures are extremely capital efficient. Black Swan Black Fridays Most traders anticipated… -
Straddle Up
|When you’re expecting a big price move but aren’t certain of the direction Implied volatility is one of the most useful metrics to consider when looking at a stock’s movement.… -
Index Breakdowns and Implied Volatilities
|The S&P 500’s Expected Move From now until the end of the year the S&P 500 is projected to move somewhere around ±6%. This is the theoretical expected price range… -
Tom Sosnoff’s Current Outlook, Trade Ideas and Crypto Moves
|Tom Sosnoff’s Portfolio and Potential Trade Ideas We asked Tom his current outlook on various markets right now, here’s what he had to say: Short: Nasdaq-100, Chip stocks, Bonds Neutral:… -
Recent Earnings Moves and a Cheaper Gold Alternative
|Earning season so far Fifty-one percent of symbols were positive after the release of recent earnings. Below are the stocks with the biggest shocks this season. Looking for a lower… -
Asymmetric Leverage, Plus the Current IV & IVR Landscape
|Asymmetric Leverage If you lose 50% in a trade, you’ll need a 100% return on the next trade, just to breakeven. Here is the math: Required Gain to Breakeven =… -
Problems with BITO, the ProShares Bitcoin ETF
|BITO is not a suitable long-term investment The ProShares Bitcoin ETF (BITO) started trading today. According to the prospectus, it does not invest directly in bitcoin. Instead it uses the… -
Kickoff to Q4 Earnings Season
|Earnings: Daily Breakdown Earning Season “officially” begins with the big banks. Expect to see the bulk of earnings at the end of this month and beginning of next. One way…