Index Breakdowns and Implied Volatilities
The S&P 500’s Expected Move
From now until the end of the year the S&P 500 is projected to move somewhere around ±6%. This is the theoretical expected price range as calculated from the option prices. In other words, at the end of the year, the prices are expected to fall within +6% or -6% from the current price with a 68% probability (which is a 1 standard deviation movement).
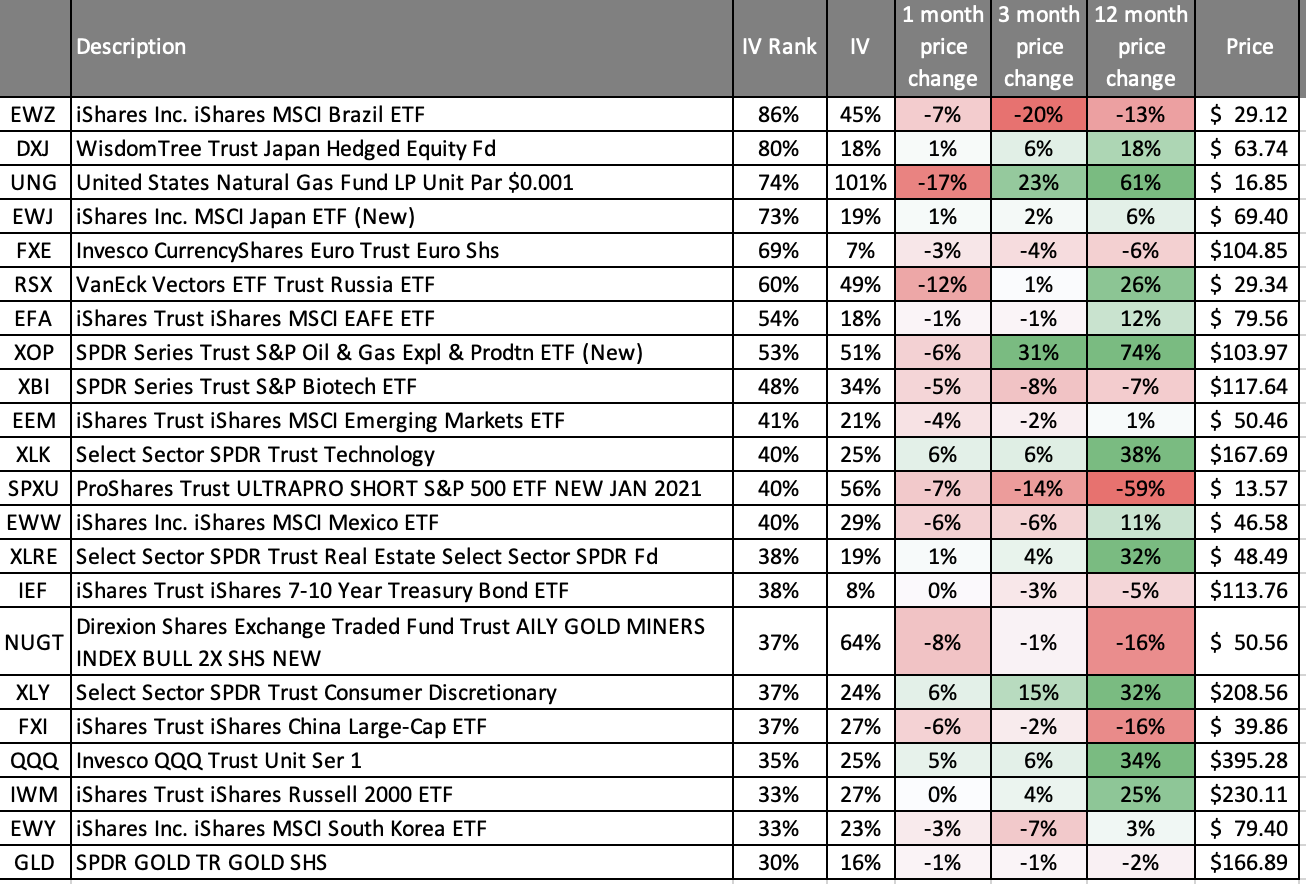
High Implied Volatility Ranks
The highest IV Ranks are shown below. Traditionally any symbol with an IV Rank above 50% is considered “fair game” for short premium, but with IV lower over the past few months and the ranges more extreme, we’ve lowered our IV Rank threshold to any symbol more than 30%.
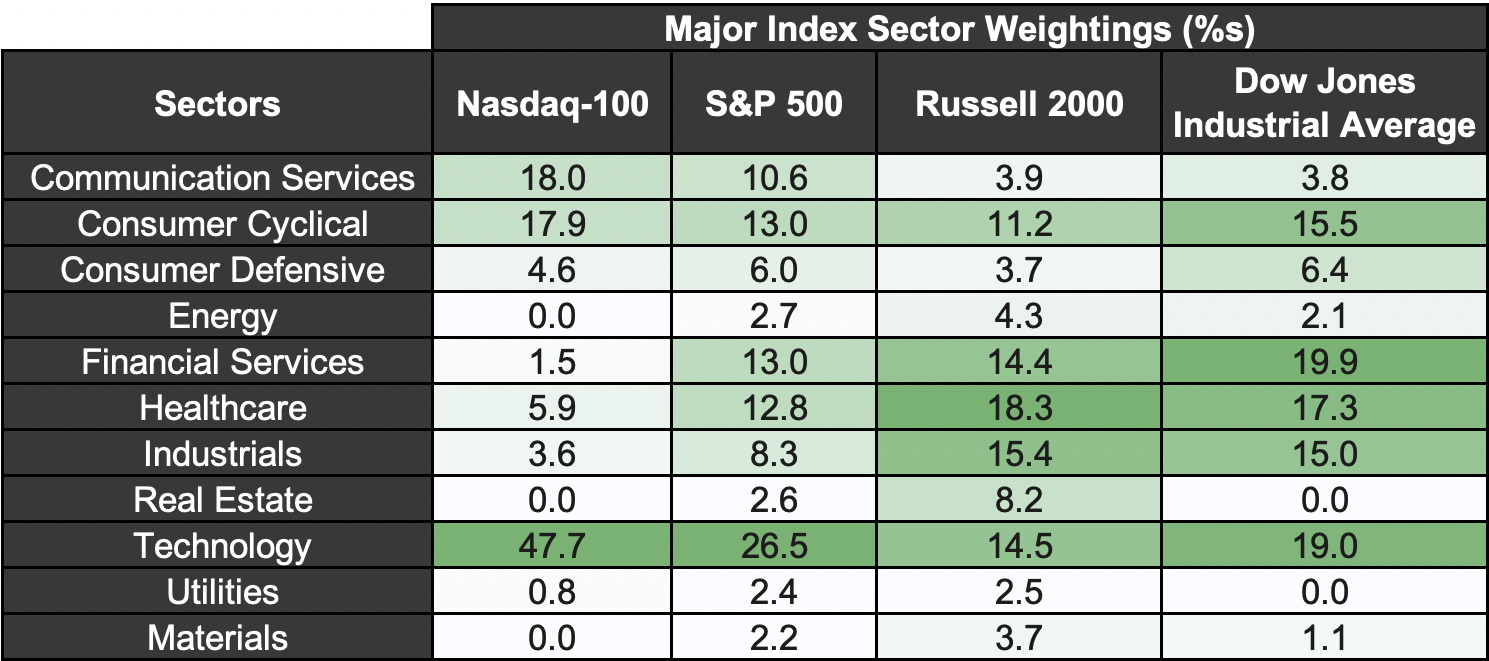
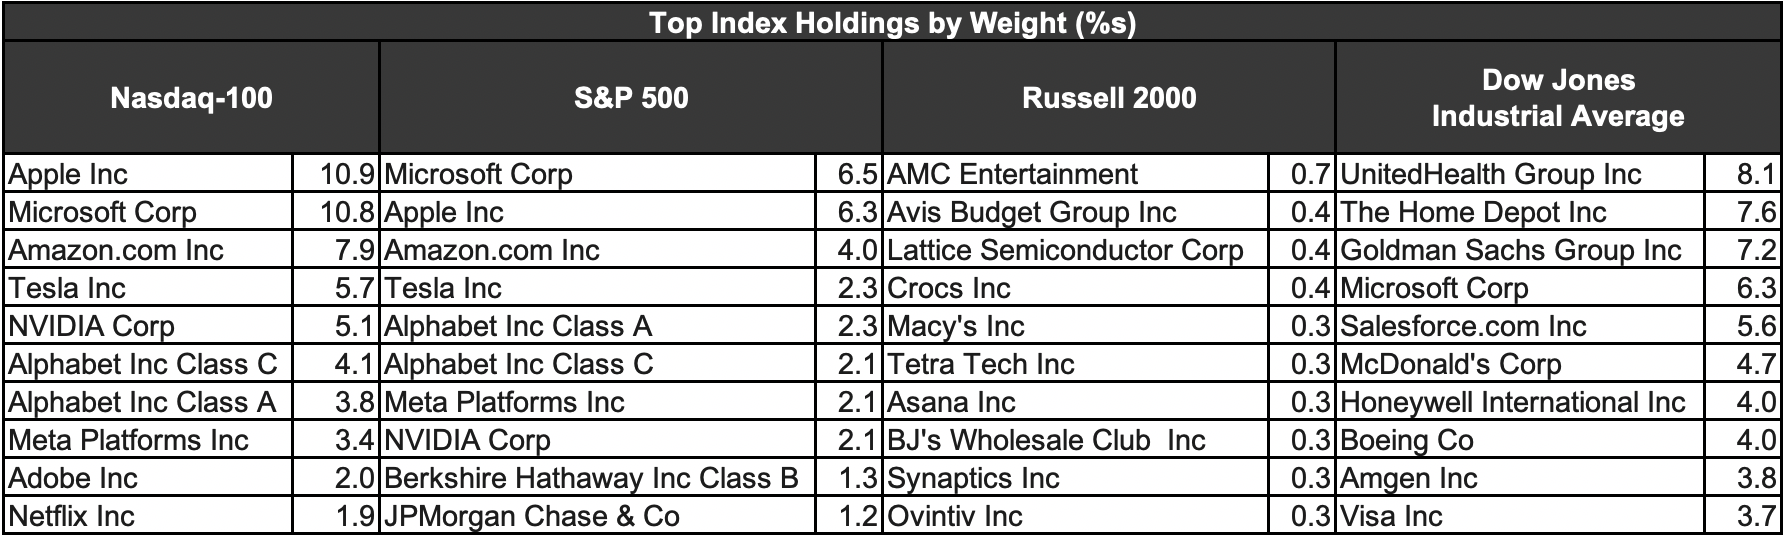
The Indices are not Created Equal
Take a look at the Nasdaq, S&P 500, Russell 2000, and the Dow Jones—the sector components are all very different. See the tables below for more information:
The free weekly Cherry Picks newsletter from tastytrade is stuffed with market research studies, data-driven trade ideas, and unique insights from the geekiest of geeks. Conquer the market with confidence … get Cherry Picks today!
Cherry Picks is written in collaboration with Michael Rechenthin, PhD, Head of Research and Development at tastytrade; and James Blakeway, CEO of Quiet Foundation, a data science-driven subsidiary of tastytrade.