The Markets are Streaking (When Naked Calls)
The S&P 500 hit fresh all-time highs this year, but the road to these new heights has been a choppy one. And based on new research conducted by the tastytrade financial network, current trading patterns may hold some under-the-radar opportunities.
A quick review of trading conditions in 2017 and 2018 helps put the current market environment in better perspective.
Calendar year 2017 in the S&P 500 was about as straightforward as can be—a continuous 12-month grind higher. But everything changed when the calendar flipped to 2018, and things have been much different over the course of the last 18 months.
Since the start of 2018, the S&P 500 has consistently trended in one direction or the other for extended periods, which has made equities markets feel a bit like a rollercoaster that simply won’t end.
For example, from the start of 2018, the S&P 500 spent two straight months dropping steadily lower. Then, in March, it reversed course and trended higher for five straight months. Next, from September to December 2018, it changed course once again—this time with more intensity. Between Labor Day and Thanksgiving last year, the S&P 500 declined nearly 15%.
Based on the above, one can likely guess what happened next—from December 2018 through April 2019. That’s right, another reversal, and a strong rally higher. And on it goes…
For traders, it’s great to recognize patterns like these in the financial markets, but it’s even more powerful when they can capitalize on trends like these.
That’s where new research by tastytrade enters the picture. Market researchers at tastytrade looked at historical data in the S&P 500 and wondered what they could learn from the last 18 months of trading, and they came up with several hard-hitting takeaways.
The method to their madness was to use historical data in the S&P 500 ETF (SPY) with the intent of understanding “streaky” markets and to backtest a variety of trading approaches that might be used to capitalize upon them.
One approach in particular showed real promise, and the results were recently presented on two different programs featured on the tastytrade financial network.
In short, the basis of the analysis was to understand streaks of consecutive “up days” and consecutive “down days” in SPY. As such, the research team decided to take a hard look at how often SPY went down in one day, two days, three days (etc…) in a row. They did the same for up days.
The results are summarized in the two graphics below, using data in SPY from 2005 to present:
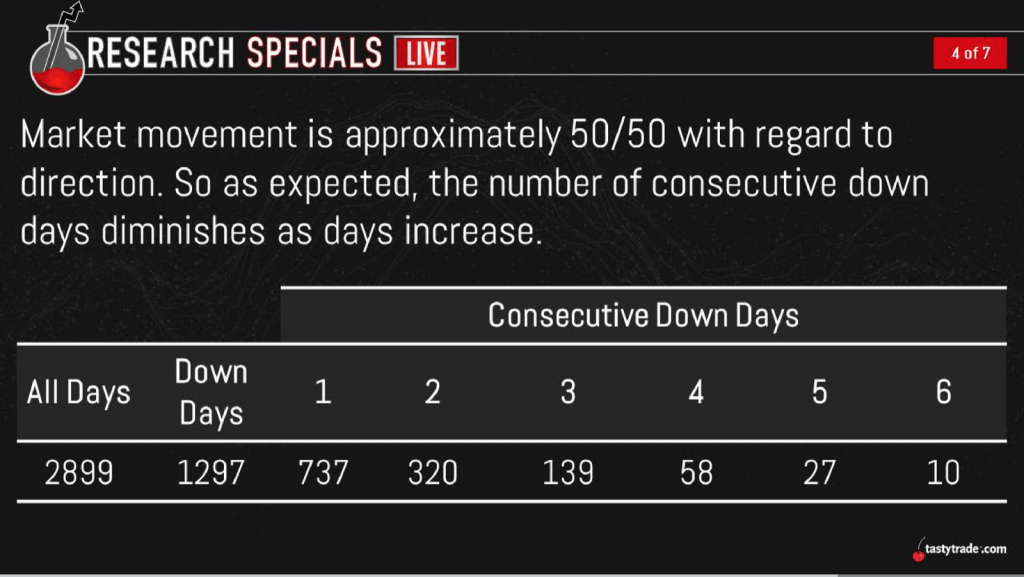
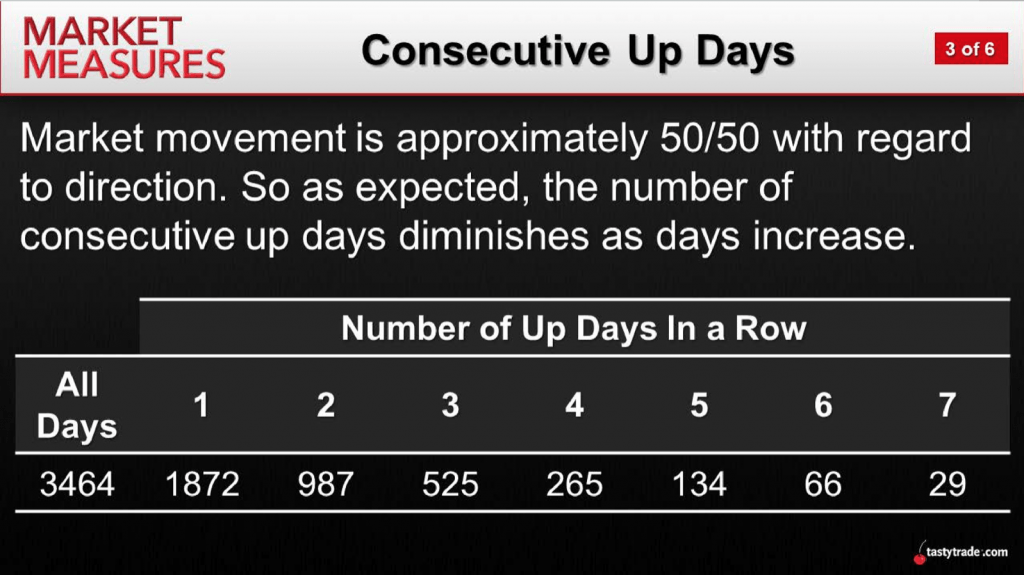
As indicated in the graphics above, historical data in SPY clearly demonstrates that as the number of consecutive days in a row increased, the total number of instances observed also went down.
For example, the number of times the S&P 500 has risen six days in a row since 2005 stands at 66. On the other hand, during this same period, the number of times the S&P 500 went down six days in a row was limited to only 10. Reducing the number to five days in a row, SPY has seen 27 such instances for down days, and 134 such instances for up days.
This data provides relevant insight into market behavior during the last 14+ years. But it’s the next layer of tastytrade analysis that provides the hard-hitting takeaways.
After reviewing the SPY data, the tastytrade research team next decided to run a series of backtests using simple options trading strategies that used the findings from the consecutive down/up days (i.e. “streaky”) data.
First, using the “down days” data, they conducted backtests that involved selling a short put in SPY for every category of consecutive down days. For example, they evaluated the performance of a short put in SPY that was deployed after the SPY had gone down for one day. Then, they evaluated the performance of a short put in SPY that was deployed after the SPY had gone down for two straight days. And so on…
The chart below summarizes the performance of short puts in this backtest, where the data is parsed into each respective category based on the number of “down days in a row” that had occurred up until the point the trade was deployed.
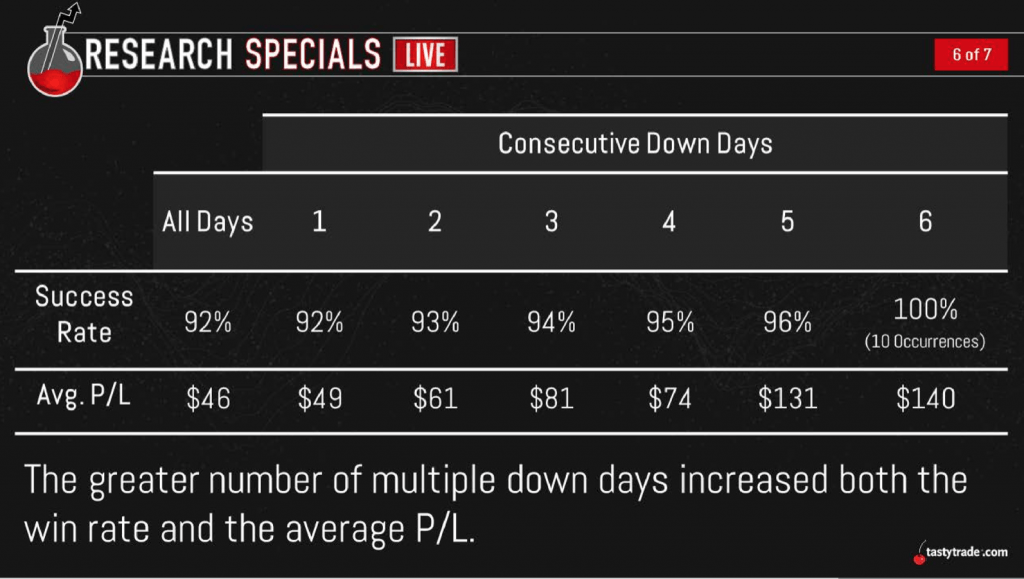
As one can see in the chart above, the success rate and average P/L of the short put approach steadily improved along with the number of consecutive down days observed. Therefore, the highest success rate and highest average P/L were observed for the short put trading approach when SPY was down seven days in a row.
The next stage of the analysis involved the “consecutive up days” data in SPY. While the backtests were similar to the previous approach, in this case the difference was that a short call was backtested instead of a short put.
Not surprisingly, the summarized data once again illustrates a clear pattern, as shown in the chart below:
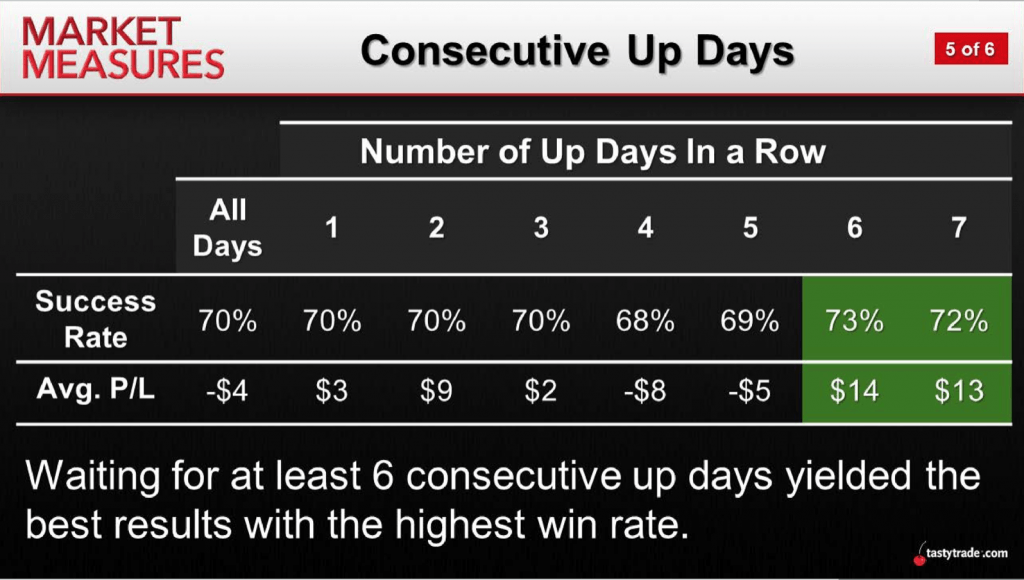
You can clearly see in the above data that the performance of the short call once again steadily improved as the number of up days increased.
For options traders that often sell puts when the market is down, or sell calls when the market is up, this new research may help with the optimization of their existing strategies. For traders who haven’t before considered trading options, this research may be a good launching point for further portfolio diversification.
Traders seeking to review the data and associated backtests in greater detail can access the complete episodes of Research Specials Live (consecutive down days) and Market Measures (consecutive up days) at their convenience.
Sage Anderson is a pseudonym. The contributor has an extensive background in trading equity derivatives and managing volatility-based portfolios as a former prop trading firm employee. The contributor is not an employee of luckbox, tastytrade or any affiliated companies. Readers can direct questions about any of the topics covered in this blog post, or any other trading-related subject, to support@luckboxmagazine.com.