The Next Market Correction Could Come Soon
Corrections of 5%-10% in the U.S. stock market used to be fairly frequent, but trading data from the most recent decade shows that trend has changed to some degree.

Market volatility has steadily decreased since the market bottomed last spring. But despite that relative complacency, it’s more than likely a correction will materialize in the U.S. stock market at some point in the foreseeable future.
Based on historical data, that correction will be of the 5% or 10% variety, as opposed to the degree of pullback observed at the outset of the global COVID-19 pandemic.
This forecast isn’t predicated on the passing of some specific future event but rather on the fact that, according to historical data, minor market corrections are relatively common—at least they used to be.
According to data previously compiled by tastytrade, the U.S. stock market experienced 200 corrections of at least 5% between the years of 1995 and 2011. Moreover, that same period saw 48 corrections of at least 10%.
This data indicates that minor corrections in the stock market are fairly common, and possibly even “healthy,” as market pundits often describe them.
On the other hand, serious market corrections of at least 20% (often referred to as “bear markets”) are much less frequent. Going back to 1946, there have been only 12 major stock market corrections in U.S. history, including the one from 2020.
The 12 major market corrections of more than 20% in U.S. stock market history are listed below.
- May 1946 (-21%)
- June 1948 (-20%)
- October 1957 (-21%)
- June 1962 (-28%)
- October 1966 (-22%)
- May 1970 (-36%)
- October 1974 (-48%)
- August 1982 (-27%)
- December 1987 (-33%)
- October 2002 (-49%)
- March 2009 (-57%)
- March 2020 (-34%)
As one can see in the above data, major corrections don’t usually occur in quick succession of one another. But of course, that doesn’t mean a significant market correction can be ruled out in the foreseeable future.
Not referenced above, one must also consider that there have been several significant market corrections of 19% (just under the 20% threshold): 1978, 1990, 1998, 2011 and 2018. That reality raises the number of “major” market corrections from 12 to 17.
Regardless, the relatively high frequency of 5% to 10% corrections in history suggests that the likelihood of a small decline in major market indexes is a much higher probability bet in the near term. It should be noted, however, that even 5% and 10% corrections have declined in frequency of late—particularly as compared with that 1995-2011 period.
For example, from 1995 to 2011, there were 48 corrections of at least 10% in major U.S. indexes, but between 2012 and the present, that figure dropped to four (not counting the 2020 bear market correction). Those four pullbacks occurred in May 2015, November 2015, January 2018 and September 2018.
And at this time, one of the more popular catalysts perceived to have a good chance of bringing down the current market is the inflation narrative. Market pundits fear that rising interest rates will provide investors and traders with another outlet for available capital and contribute to an exodus from the stock market.
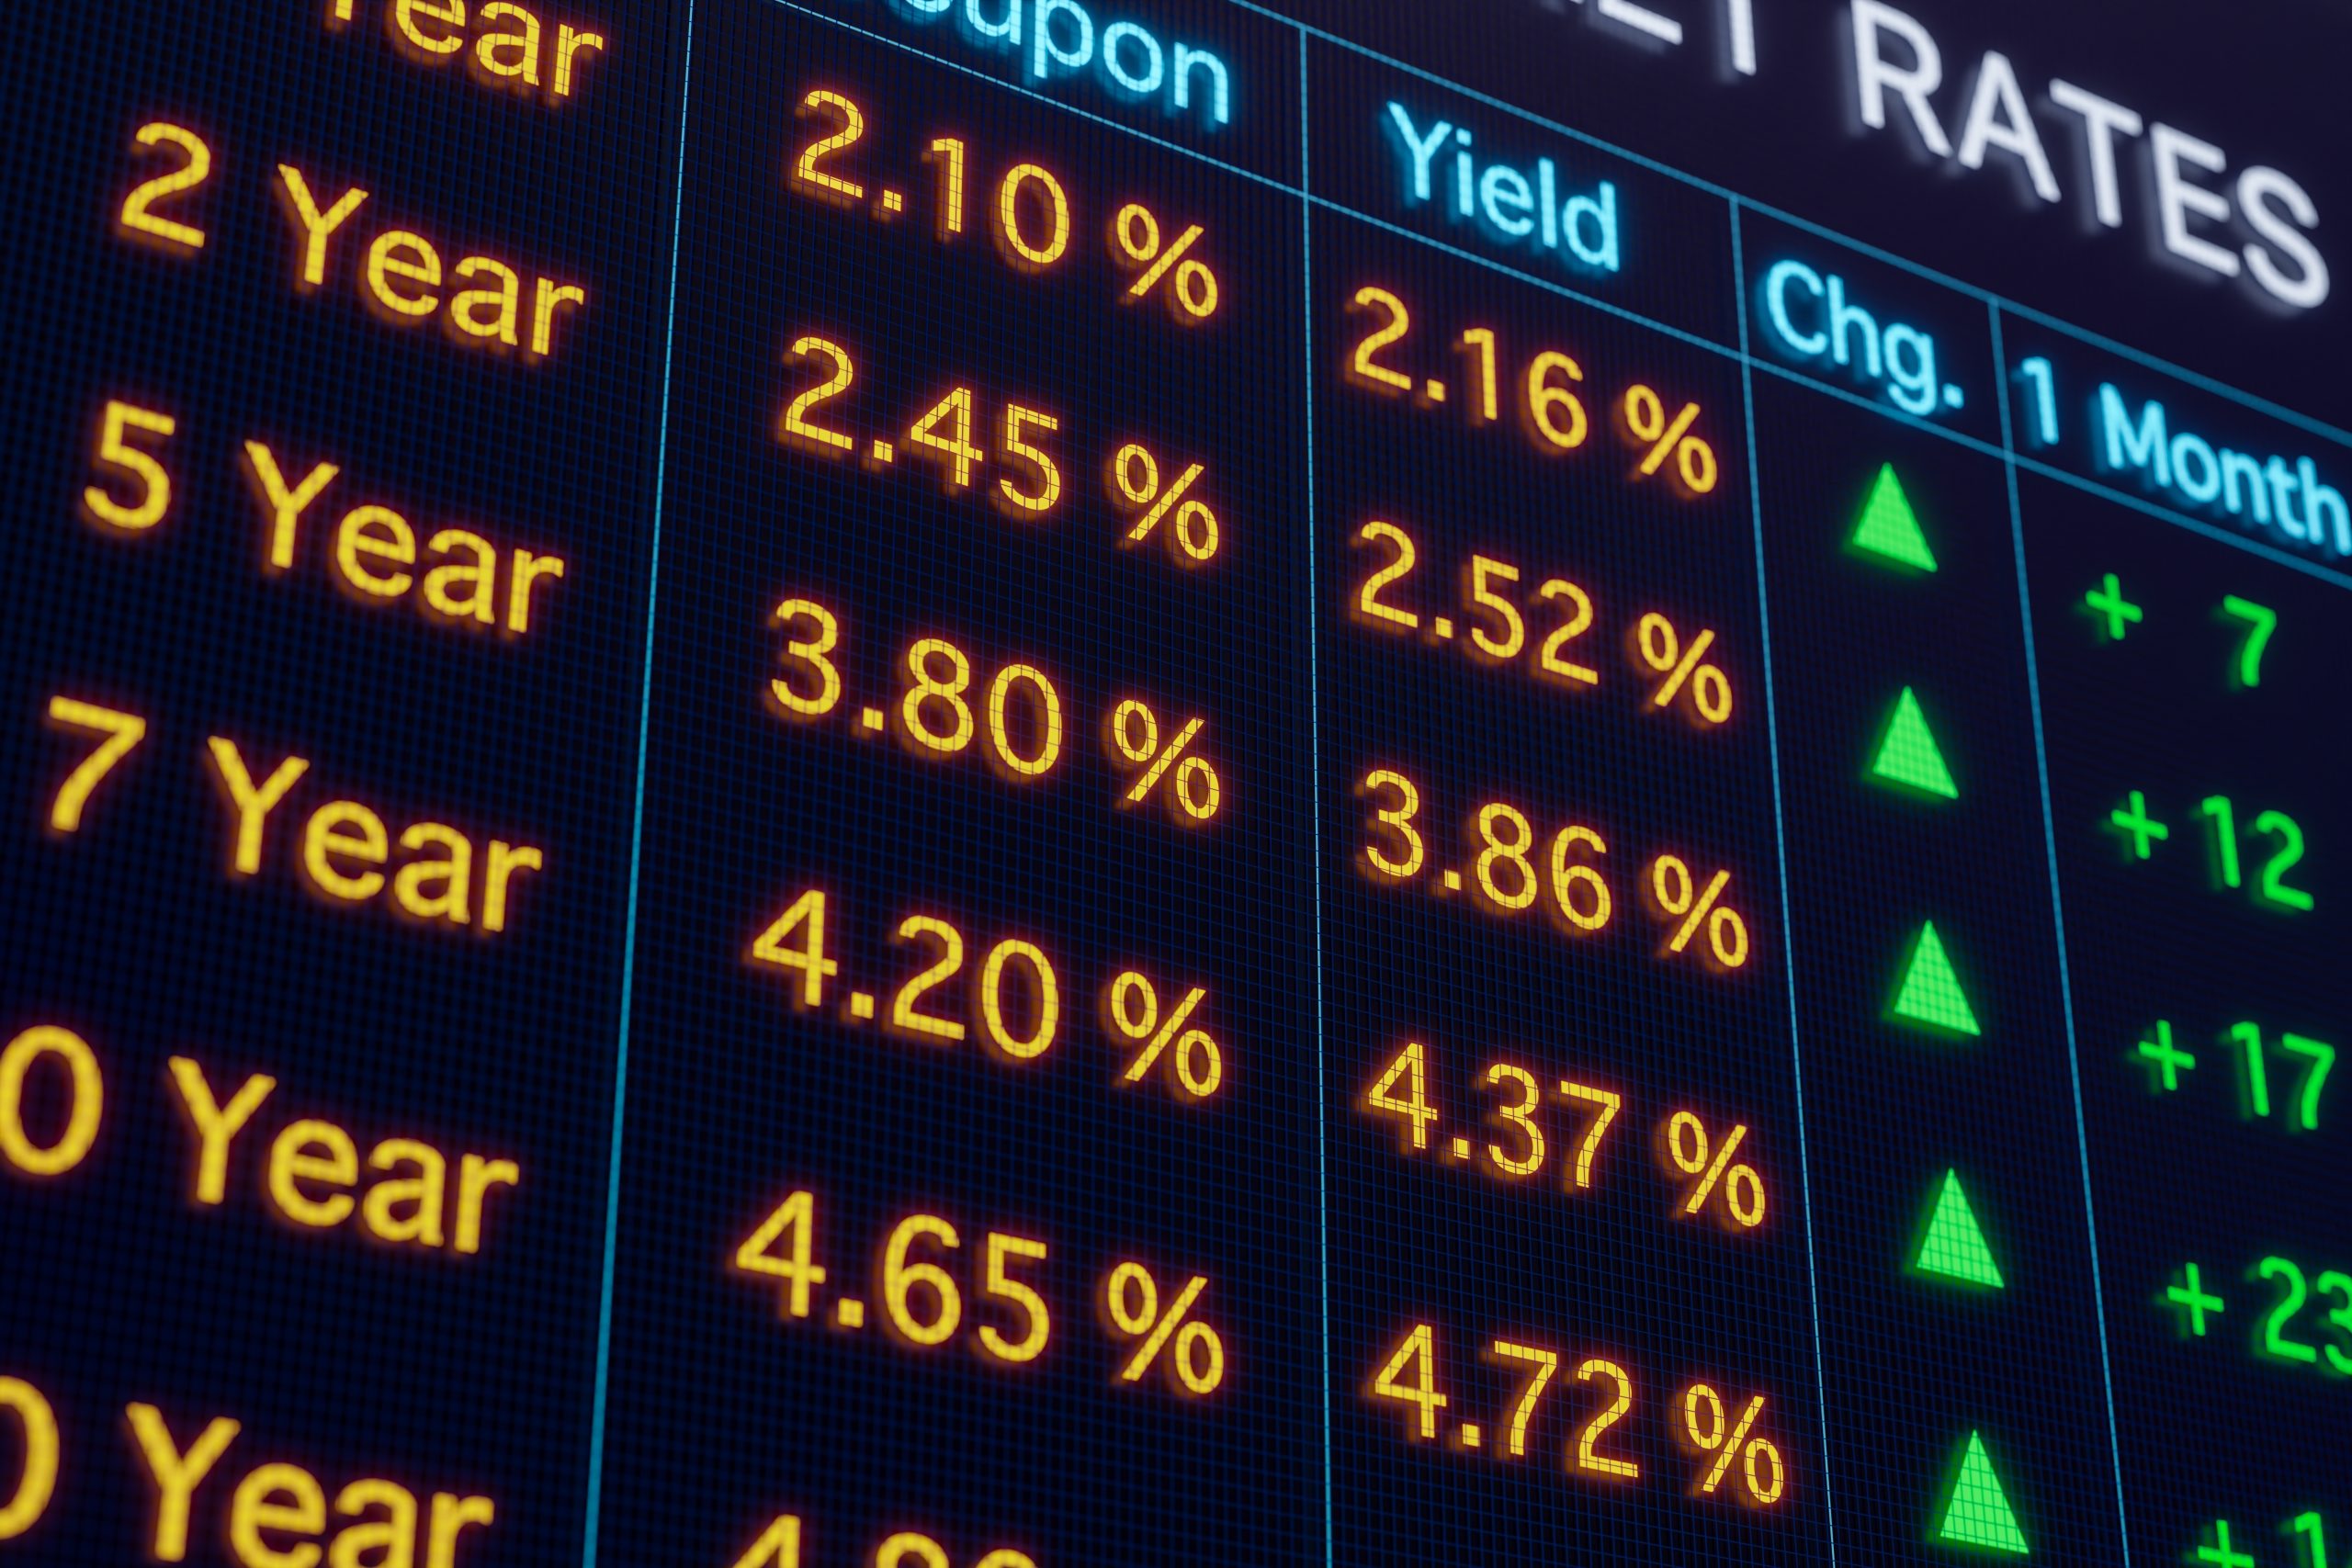
Investors and traders seeking to track the potential for rising interest rates in the U.S. economy therefore may want to start following U.S. Treasury yields. The 10-year U.S. Treasury yield is currently trading about 1.59%.
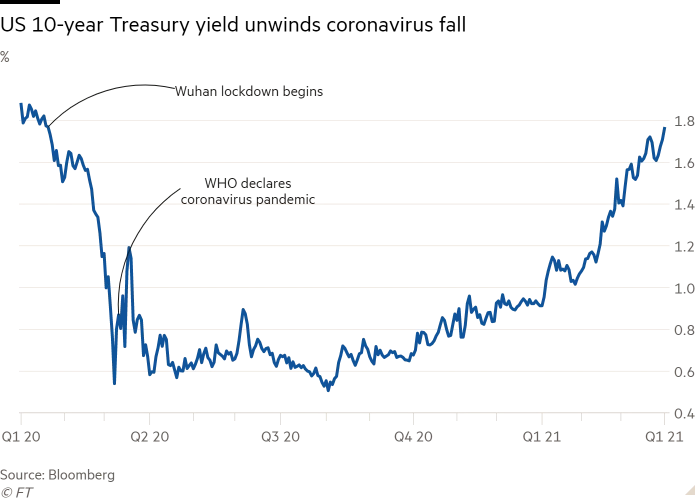
In late March, the investing community appeared to take note when the stock market began to slide alongside a simultaneous rally in the 10-year yield above 1.75%. It’s widely believed that 2% is an important line in the sand for the 10-year yield and that any move in the 10-year above that level could be the “straw that broke the camel’s back” as it relates to the current market rally.
To learn more about the history of 5%-10% corrections, and how the frequency of such pullbacks has declined in recent years, readers may want to review this previous installment of Market Measures on the tastytrade financial network.
For updates on everything moving the markets, readers can also tune into TASTYTRADE LIVE weekdays from 7 a.m. to 4 p.m. Central Time at their convenience.
Subscribe to receive 10-issues of Luckbox in print! See SUBSCRIBE or UPGRADE TO PRINT (upper right) for more info.
Sage Anderson is a pseudonym. He’s an experienced trader of equity derivatives and has managed volatility-based portfolios as a former prop trading firm employee. He’s not an employee of Luckbox, tastytrade or any affiliated companies. Readers can direct questions about this blog or other trading-related subjects, to support@luckboxmagazine.com.