TLT ETF ABCs v SPY + ZIRP = Opportunity
Don’t look now, but the iShares 20+ Year Treasury Bonds Exchange-Traded Fund (TLT) has quietly pushed back toward its all-time high and is trading just above $143. The all-time high came in late August when TLT climbed to $148.90.
While the full name might sound like a mouthful, the TLT serves as a proxy for long-term U.S. government bond prices (20+ years) in ETF form. That’s outlined in the fund summary, which indicates TLT invests “at least 95% of its assets in U.S. government bonds.”
Even investors who aren’t trading bonds on a daily basis find this an important niche of the financial markets that they should monitor. Given current market conditions, it’s arguable that assertion has never been more true than today.
As a case in point, U.S. interest rates have been in the news in 2019 because of big daily and weekly moves, as well as brief periods when the U.S. yield curve has gone “inverted.”
However, thinking more broadly, the introduction of negative interest rate policies (NIRP) in many countries around the globe in recent years also reinforces the importance of the interest rate and government bond sectors.
After all, interest rates aren’t just a tool for sovereign governments to manage their own economies. They also fall under the umbrella of broader “monetary policy,” which nations are increasingly using to ensure their marketplaces are competitive on the world stage. The dovish stance that the central bank in China is taking, coupled with a deep devaluation of the Chinese yuan, provide clear evidence of how countries can use monetary policy to combat external economic pressure.
Aside from global interest rate considerations, another reason the TLT can be such a powerful tool for investors and traders relates to the fact that it theoretically offers an outlet for portfolio diversification. However, before touching on that, readers may want to review a brief summary of the TLT construction and mechanics.
The TLT continuously inventories its portfolio of a group of U.S. government bonds that are usually greater than 20 years in terms of expiration date. When holdings pass below the 20-year mark, TLT administrators sell those bonds and roll into other bonds with the desired target maturity.
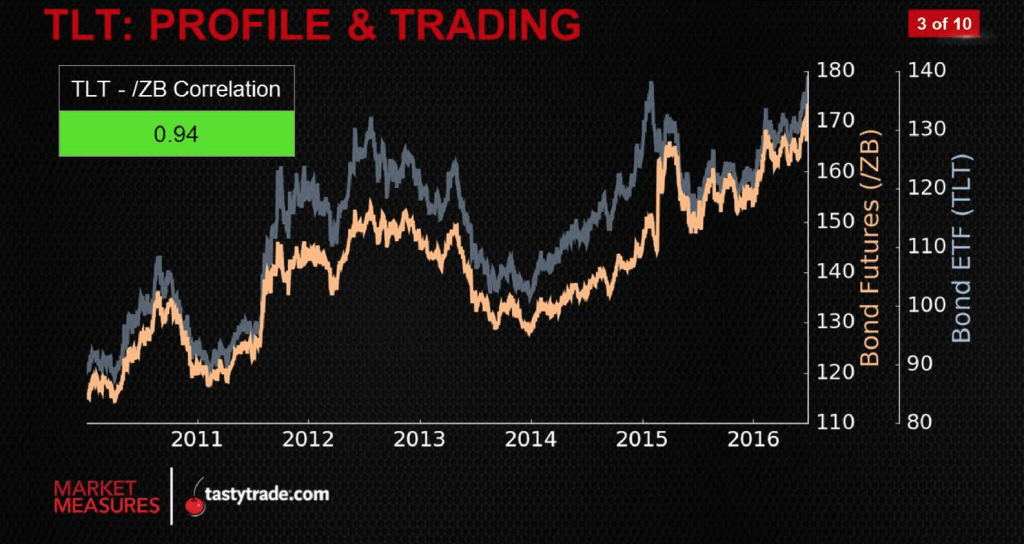
As one might expect, the TLT is highly correlated to real bonds in terms of price returns. The chart below illustrates the extremely high historical positive correlation between TLT and 30-year U.S. Treasury Bonds (/ZB).
And while the chart shows TLT sharing a strong, positive correlation with government bonds, it’s the TLT’s correlation with the SPDR S&P 500 trust (SPY) that sets it apart as a potential portfolio diversifier.
Looking at the historical trading relationship between SPY and TLT, one can see in the exhibit below that the two often share a strong negative correlation (the opposite of TLT and /ZB).
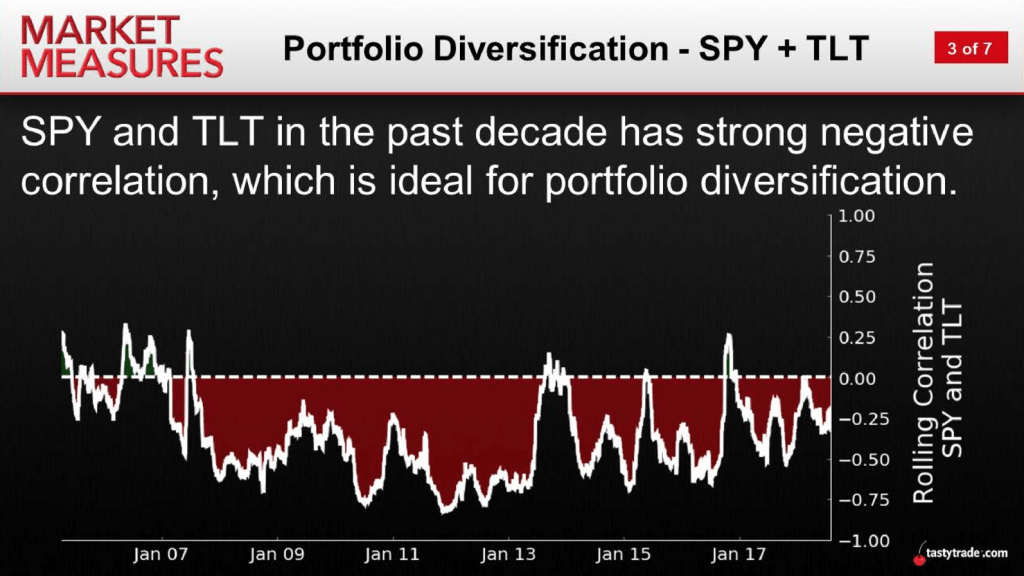
The above generally means that when either SPY or TLT moves up, the other one tends to move down and vice versa. While that relationship tends to cycle between semi-strong and strong, the good news for traders is that the two are definitely not positively correlated.
That’s important because traders can confidently deploy similar trading strategies in each underlying without worrying that they’ve doubled down and created two highly correlated exposures. For example, a short put in TLT and a short put in SPY wouldn’t likely be subject to the same degree of risk on a big down day in SPY because of the inverse correlation between TLT and SPY.
So far this year, the rally in government bond prices has been instrumental in pulling the TLT higher. The big question is how central bankers in the U.S. will approach the next rate cut decision, which in turn appears likely to hinge on the perceived strength of the U.S. economy.
The next meeting of the U.S. Federal Reserve is scheduled for October 29-30.
Traders seeking to learn more about the U.S. interest rates landscape would be well-advised to review a recent episode of Futures Measures on the tastytrade financial network.
This edition of the series provides a comprehensive summary of movement in U.S. interest rates (across the spectrum of expirations) so far in 2019. Data highlighted on the show also provides insight on where the biggest moves have occurred, and what that could imply going forward.
Additional information about trading interest rates using U.S. government bond futures is available in the tastytrade LEARN CENTER.