Trading Bullish Momentum in the Gold Market
The price of gold is up roughly 18% since the start of November, and the recent rally appears to have been triggered by a breakdown in the U.S. dollar
The price of gold has rallied by about 18% since Nov. 1, and the metal’s current momentum could push it to a fresh record high at some point in H1 2023.
Gold is currently trading for around $1,930/ounce, with the all-time high having been set at $2,075/ounce in August 2020.
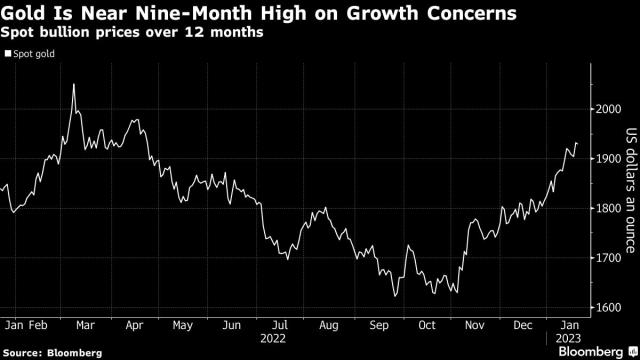
One trend that appears to be boosting the gold market is a sharp reversal in the value of the U.S. dollar.
Dollar strength was a key theme during the 2022 trading year. But the rally in the U.S. dollar peaked at the end of October last year, and weakness in the greenback appears to have lit a fire under gold. The two have been moving in opposite directions for about 10 weeks now.
The recent rally in gold has helped bring credence to the long-held belief that the precious metals sector tends to perform well amid elevated levels of inflation. A theory that came under serious pressure last year, when gold prices traded sideways among record-high inflation.
Back in the late 1970s and early 1980s, gold prices soared as the Federal Reserve rapidly increased benchmark interest rates in the U.S. to combat inflation. But in 2022, that same Fed activity had far less impact on the gold market.
However, it appears that dollar strength was the true kryptonite for gold prices in 2022.
Traditionally, the buying power of the U.S. dollar declines in inflationary environments. That was somewhat true in 2022 as goods got more expensive, but the dollar also appreciated in value in relation to most of the world’s other best-known currencies. That may help explain why the gold trade failed to lift off last year.
But with the greenback now in retreat, gold has attracted newfound interest—suggesting that continued weakness in the dollar could be a key determinant of the fate of the gold market in 2023.
The recent rally has also spawned fresh optimism over gold’s potential in 2023.
For example, in an analysis published in Seeking Alpha, Avi Gilburt, an Elliott Wave market analyst, recently asserted that his next major target in the gold market is just over $2,400/ounce. That forecast relies on an Elliot Wave analysis.
However, Juerg Kiener—managing director and chief investment officer of Swiss Asia Capital—is even more bullish on gold prices. Mr. Kiener recently told CNBC that he expects gold prices to break above $2,500/ounce at some point soon, and even rally as high as $4,000/ounce under the right circumstances.
His forecast relies on a slowdown in rate hikes, as well as stubbornly high inflation, which Mr. Kiener believes will help push gold prices rapidly higher after the Fed pivot. Mr. Kiener also bases his forecast on persistently strong demand in the gold market, especially from global central banks.
In the third quarter of 2022, central bankers around the world bought a record 400 tons of gold, which was well above the previous total for a single quarter. The previous record was established in 2018, when the world’s central bankers bought a combined 241 tons of gold, also in the third quarter of the year.
The surge in demand for gold in 2022 by global central banks is illustrated below.

Source: weforum.com
Gold-silver ratio update
When assessing opportunities in the gold market, most longtime market participants also analyze the gold-silver ratio.
The gold-silver ratio is calculated by taking the price per ounce of gold and dividing it by the price per ounce of silver. The quotient of that equation reports how many ounces of silver are required to buy a single ounce of gold at any given point in time.
Over the last 20 years, the gold-silver ratio has ranged between about 40 and 120, but in the last decade that range has tightened to between roughly 60 and 120.
For reference, the gold-silver ratio is currently trading around 79 ($1,900/$24.00 = 79), which means at its current level, the gold-silver ratio is basically trading right around its average value over the last 10 years.
Traditionally, pairs traders get more interested in the gold-silver ratio when it reaches an extreme—either toward the upper end, or the lower end, of its historical range.
When the gold-silver ratio is at the upper end of its historical range, traders frequently deploy a position that benefits as the ratio declines (short gold, long silver). The reverse trade (long gold, short silver) can be executed when the gold-silver ratio trends toward the lower end of its historical range. In either case, the trade structure relies on the ratio reverting toward its mean.
Considering where the ratio is right now, most investors and traders in precious metals markets are likely considering directional bets in gold, or volatility-focused positions, as opposed to pairs trades.
For more background on the gold trade, check out this episode of Splash Into Futures. To follow everything moving the markets in 2023, watch tastylive, weekdays from 7 a.m. to 4 p.m. CDT.
Sage Anderson is a pseudonym. He’s an experienced trader of equity derivatives and has managed volatility-based portfolios as a former prop trading firm employee. He’s not an employee of Luckbox, tastylive or any affiliated companies. Readers can direct questions about this blog or other trading-related subjects, to support@luckboxmagazine.com.