Trading China’s Coronavirus (Part 10)

It’s a Trader’s Market as Yields Go Haywire
Coronavirus Updates:
- The estimated number of total global coronavirus infections has risen to 80,087 with at least 2,699 associated fatalities
- Approximately 33 deaths linked to the novel coronavirus have occurred outside of mainland China (France 1, Hong Kong 2, Iran 12, Italy 7, Japan 1, Philippines 1, South Korea 8, and Taiwan 1)
- The U.S. Centers for Disease Control and Prevention (CDC) announced there are currently 53 confirmed cases of COVID-19 in the United States (zero fatalities)
- Moderna (MRNA) shipped its first batch of a COVID-19 vaccine to U.S. government researchers. Moderna collaborated with the National Institute of Health, the National Institute of Infectious Disease and the Vaccine Research Center to develop the experimental inoculation
- New outbreaks in Iran, Italy and South Korea have added to growing worries over the spread of COVID-19
- The Dow Jones Industrial Average plunged 3.56% on Monday, its largest drop since February 2018
- The World Health Organization (WHO) no longer uses the term “pandemic” to describe outbreaks and has warned government leaders instead to prepare for a “public health emergency of international concern”
- A gathering of the Chinese Parliament (National People’s Congress), expected to convene in early March, has been delayed for the first time since the Cultural Revolution
- Chinese authorities have banned the trade and consumption of live animals on the heels of the COVID-19 outbreak
- More than 3,000 medical workers have now been infected by the novel coronavirus in mainland China
The coronavirus narrative, which has dominated the current news cycle, has now splintered into several smaller, troublesome tributaries.
One such story gaining momentum as a result of the spreading outbreak is the challenge presented by declining global economic activity, which has sparked fresh concerns over the likelihood of a potential global recession.
A big red flag that’s underscored these worries is the fact that U.S. interest rates have once again “inverted.”
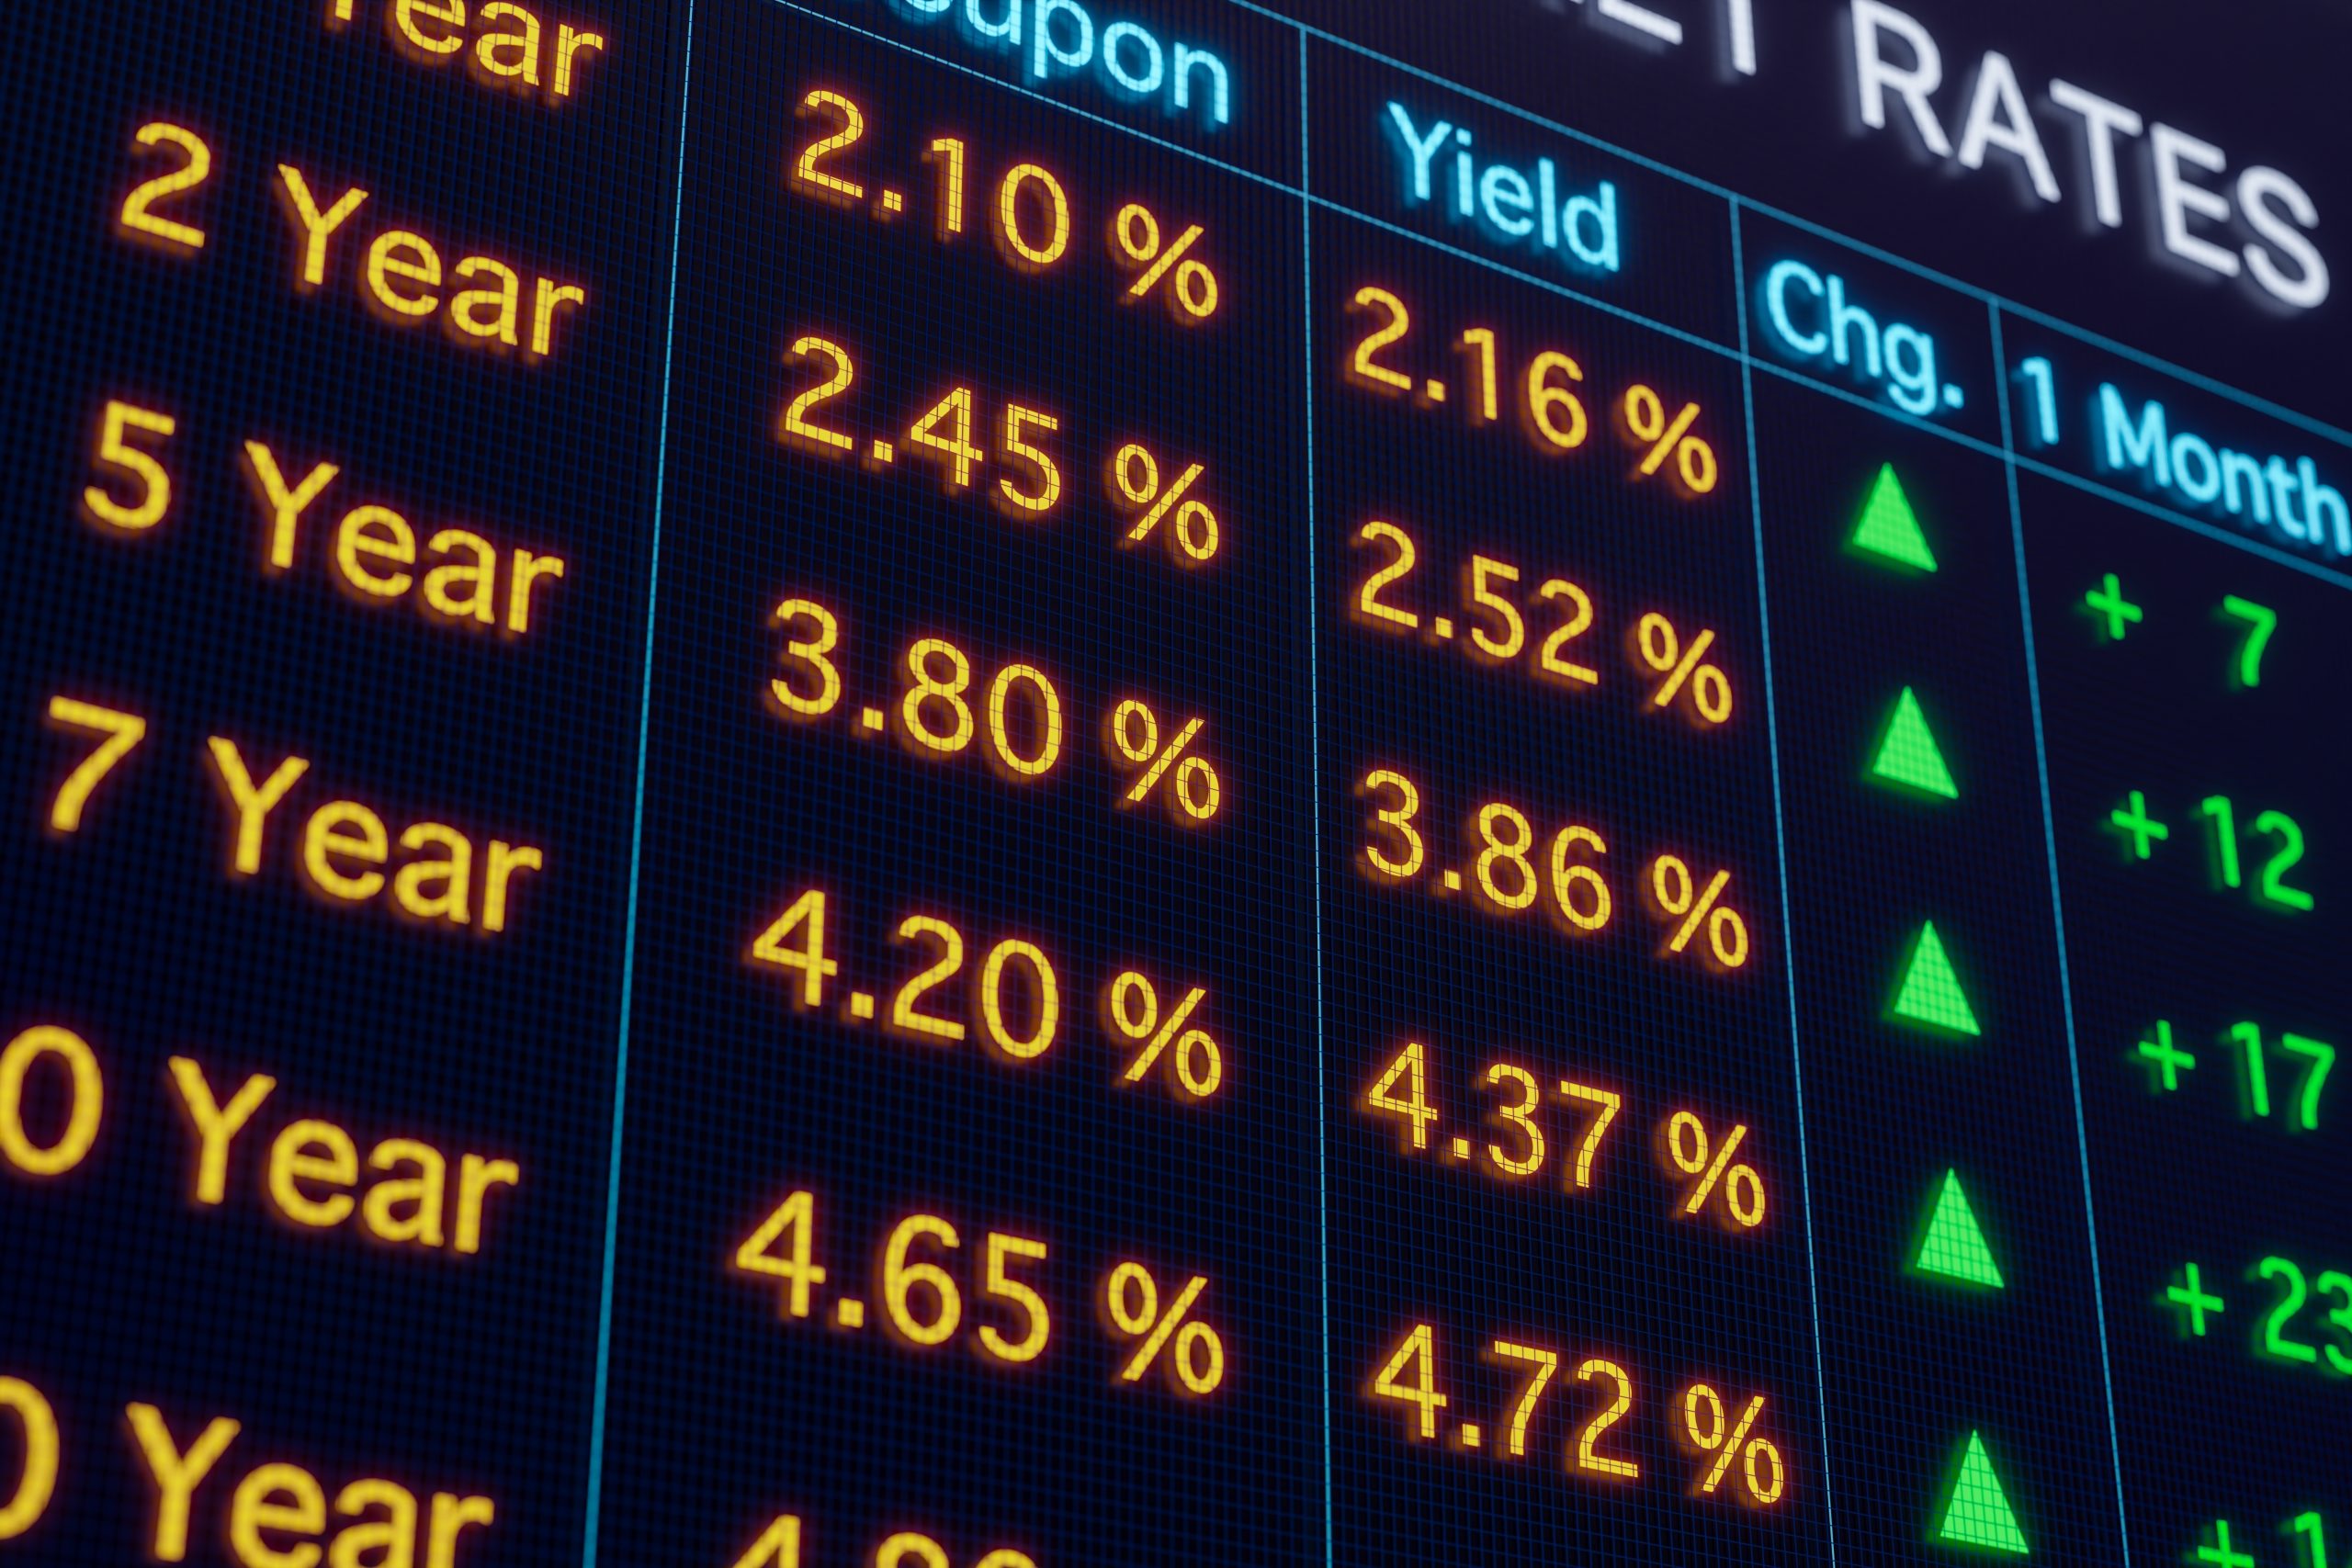
On Feb. 18, the U.S. yield curve experienced another inversion when the 10-year Treasury yield dropped below the yield on the 3-month Treasury Bill. At that time, the 10-year yield was trading roughly 1.54%, while the 3-month Treasury Bill was trading at 1.58%.
On Monday, when U.S. equity markets crashed, the plunge in yields picked up momentum.
On the first day of trading this week, the 10-year Treasury yield dropped to 1.35%, which is the lowest reading in that instrument since July of 2016. Following closely on the heels of that “flight to safety” was a similar drop in the 30-year Treasury yield, which hit its all-time low of 1.81% on the same day.
Generally speaking, long-term interest rates reflect future expectations for short-term interest rates. So when long-term rates drop below short-term rates, often referred to as a “yield curve inversion,” that means expectations for the underlying economy are likely deteriorating.
In American history, yield curve inversions have almost always been followed by economic recessions. However, the lag between an inversion and the actual onset of a recession has varied greatly—from a couple of months to nearly two years.
The chart below highlights the most recent yield curve inversions in the United States alongside the elapsed time until the onset of an ensuing recession:
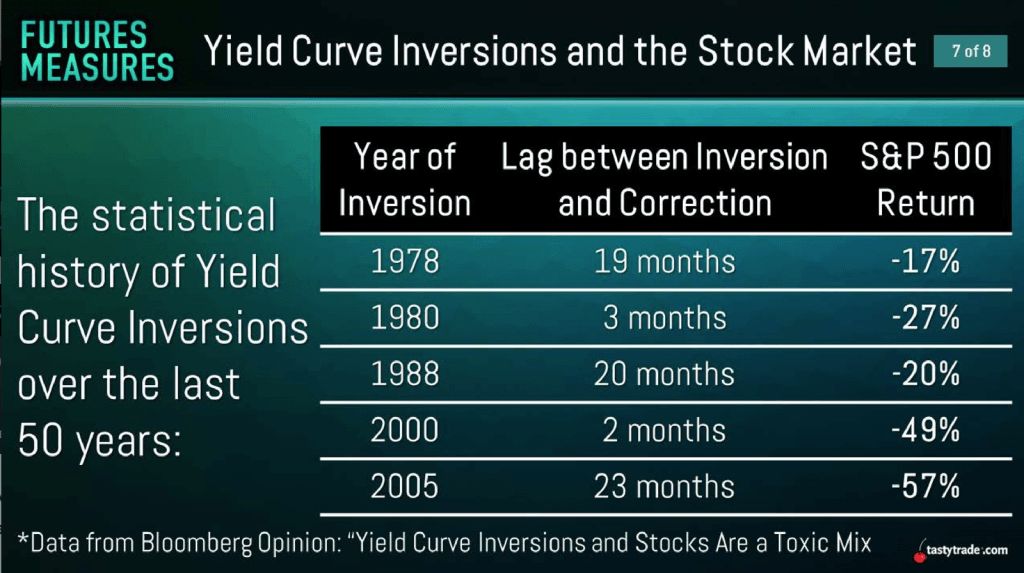
The chart above illustrates not only that economic recessions have traditionally followed yield curve inversions, but also that stock market pullbacks have typically followed as well.
As many market participants might recall, the “yield curve inversion” story first took flight in August 2019, when the U.S. yield curve inverted for the first time since 2005. It’s important to note that the yield curve inversion in 2005 was followed roughly 23 months later by the Financial Crisis and Great Recession.
Considering the above, that means it has now been about six months since the first red flags started billowing with regards to a potential recession. The big question now is when the next recession might occur, if one does indeed materialize.
New research released by the MIT Sloan School of Management (in conjunction with State Street Associates) might help with answering that question.
Researchers at MIT recently designed a predictive economic model—incorporating data on industrial production, nonfarm payrolls, stock market returns and the slope of the yield curve—which concluded the likelihood of a recession materializing in the United States during the next six months was about 70%.
Backtesting data from 1916 to present, the researchers found their methodology was highly accurate in terms of its predictive capability. At the same time, one must keep in mind that this is a new approach to analyzing the timing for a potential recession and has no previous track record of success.
Regardless, experts agree that a strong link exists between yield curve inversions and economic recessions, and for this reason, investors and traders will undoubtedly be closely monitoring the yield curve in the near future to track ongoing fluctuations.
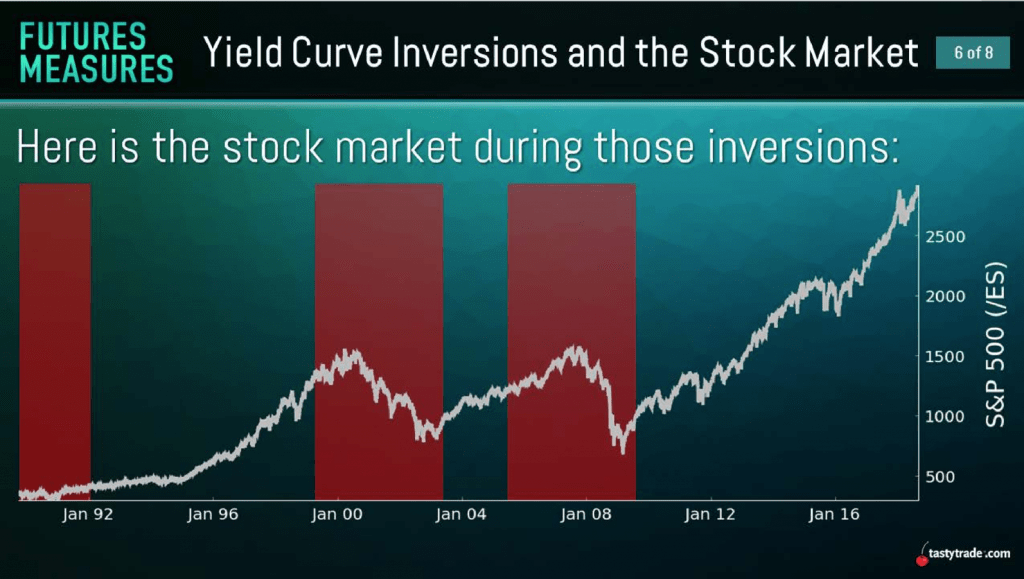
As one can see in the chart below, periods of economic recession in the United States aren’t typically easy on equity markets:
With stock markets currently reeling—and economic uncertainty growing—the potential for a rate cut by the U.S. Federal Reserve at their next meeting in mid-March is now looking more likely.
If economic growth is further impaired by the coronavirus outbreak, some pundits have even suggested that the U.S. central bank might consider calling an emergency meeting prior to March 17-18. The last emergency meeting held by the Federal Open Market Committee (FOMC) was held in October of 2008.
Readers seeking to learn more about the yield curve and associated economic recessions may want to review a previous installment of Futures Measures on the tastytrade financial network when scheduling allows.
Additional information about trading the yield curve can also be accessed here.
Sage Anderson is a pseudonym. The contributor has an extensive background in trading equity derivatives and managing volatility-based portfolios as a former prop trading firm employee. The contributor is not an employee of Luckbox, tastytrade or any affiliated companies. Readers can direct questions about topics covered in this blog post, or any other trading-related subject, to support@luckboxmagazine.com.