Trading Election Year Volatility

The VIX has behaved abnormally in recent weeks, and pundits have attributed that aberration to the looming presidential election.
But that’s not the full story, as economic risks associated with the ongoing pandemic are also contributing to growing fear in the marketplace.
Historically, the VIX has exhibited a strong negative correlation with broad-based market indexes such as the S&P 500 and the Nasdaq. Over the last decade, the negative correlation between the S&P 500 and the VIX has averaged about -0.83.
The correction in the stock market at the start of 2020 confirmed this trend. When the S&P 500 dropped to its March lows, the VIX established a new all-time high. And as the stock market rebounded in spring and summer, the VIX followed suit by falling back from those highs.
That is, until recently.
Since late summer, the rally in stocks has continued, but the decline in VIX has slowed—and even reversed to some degree. Recently, the VIX appears to have decoupled from its normal negative correlation with the indexes, and a brief review of some key data points helps illustrate this puzzling development.
When the S&P 500 hit its previous all-time high in February, the VIX was trading under 14. The S&P 500 established a new all-time high this week, but VIX remains above 26.
Moreover, consider that the S&P climbed by 34% from March 23 to June 11, while the VIX dropped by 33% during this same period. But since July 22, the S&P 500 has climbed an additional 7%, while the VIX hasn’t followed suit.
The “fear gauge” (aka the VIX) was actually higher at the start of this week, than it was on July 22.
Adding fuel to the fire, the VIX jumped 15% on Monday—a gap move usually reserved for dramatic down days in the indexes. But on Monday, the Dow was down a mere 200 points (less than 1%), and the Nasdaq was actually up on the day.
Not the type of stats that typically characterize a big spike in VIX.
Some market pundits have suggested that the recent decoupling of VIX from its traditional pattern is due to the upcoming presidential election on Nov. 3. However, looking at the most recent presidential election held in 2016, the data doesn’t necessarily support that assertion.
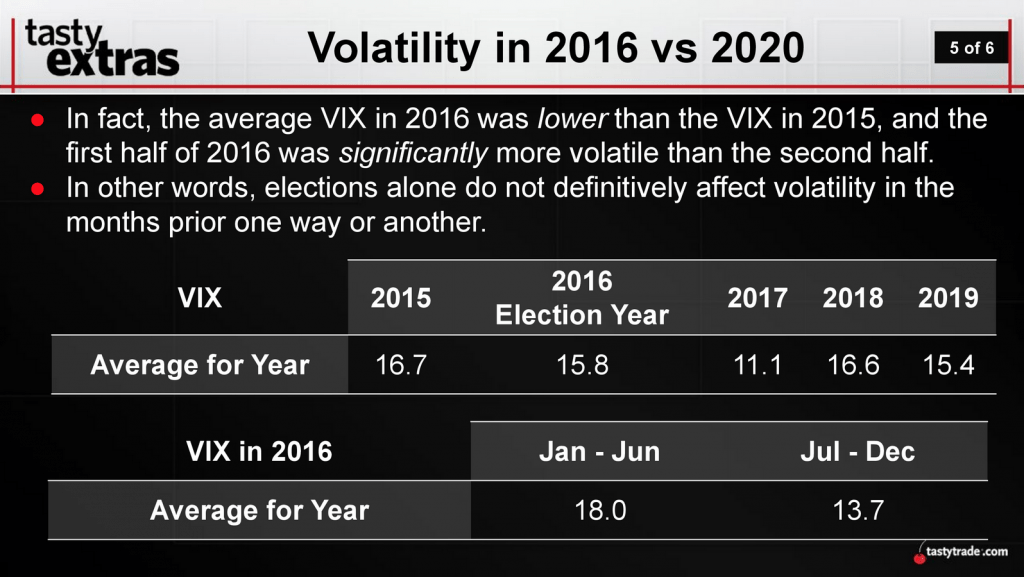
According to research conducted by tastytrade, market volatility declined during 2016 heading into the presidential election, after a fairly volatile first half of the trading year.
As shown in the graphic below, VIX averaged about 18 during the first half of 2016, while dropping to an average of about 14 during the second half (a period which included the 2016 presidential election).
While no trading year is exactly the same, one could argue that there was as much at stake in the 2016 election as there is in the 2020 election—from a political standpoint.
Outside of the election, it’s more likely that continuing uncertainty around the impact of the coronavirus is responsible for an unusually inflated VIX. And right now, uncertainties appear to be mushrooming.
Prior to the most recent Congressional recess on Aug. 13, it was widely believed Democrats and Republicans would bridge their differences and provide another lifeline to relieve individuals and businesses suffering from the pandemic—in the form of another economic stimulus package.
However, those negotiations have stalled, and the gulf between the competing proposals remains significant. While the economy has recovered somewhat since the depths of the crisis, things are by no means back to “normal.” The unemployment rate in the United States remains above 10%, which is extraordinarily high by historical standards.
This week, senior representatives from both the Federal Reserve and the U.S. Treasury Department called on lawmakers to find common ground, and soon.
But with the deal still hanging in the balance, a rising VIX likely indicates that investors and traders are buying insurance to protect against the possibility that additional measures are not enacted.
Under that frightful scenario, it’s hard to imagine that the economy—and potentially the stock market—would escape unscathed. It’s almost certain that the absence of further stimulus measures would see the existing “ghost recession” solidify into something much more tangible, and frightening.
VIX has historically served as the “canary in the coal mine,” and the recent decoupling of the fear gauge from the stock market rally is a worrisome sign. The recent 15% spike in VIX, on an otherwise unremarkable trading day, provides further evidence that something may be amiss.
For more information on the behavior of volatility during the last presidential election, readers can review a recent episode of Tasty Extras on the tastytrade network.
Additionally, the upcoming issue of Luckbox will provide expanded coverage on predictions and probabilities associated with the potential outcome of the Nov. 3 election.
Sage Anderson is a pseudonym. The contributor has an extensive background in trading equity derivatives and managing volatility-based portfolios as a former prop trading firm employee. The contributor is not an employee of luckbox, tastytrade or any affiliated companies. Readers can direct questions about any of the topics covered in this blog post, or any other trading-related subject, to support@luckboxmagazine.com.