Trading Extreme Volatility Conditions

It’s not every year that the CBOE Volatility Index (VIX) sets a new all-time high. In fact, it was about 12 years ago the last time that occurred, in 2008.
During each of these instances, the U.S. economy was experiencing extreme distress—a pattern worth noting, in case the economy starts to sputter at some point again in the future.
The tastytrade financial network has already conducted extensive research comparing the current spike in VIX to the one seen in 2008. But those aren’t the only two times in history that the VIX traded above 80.
As illustrated in the graphic below, volatility data from 1928 to 1993 reveals three additional instances in which the VIX traded above 80.
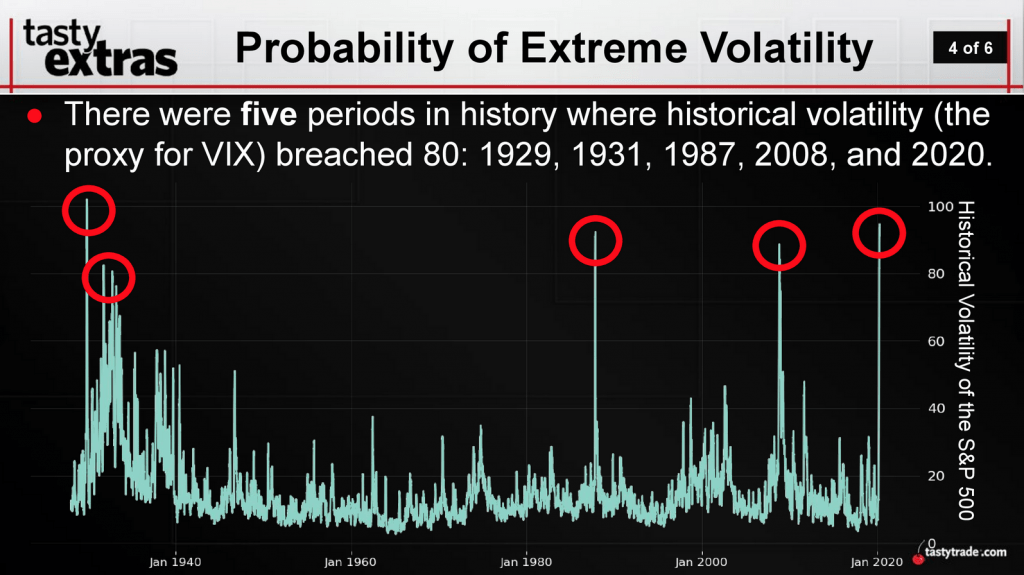
In sum, the above means that the VIX has broken above 80 five times: 1929, 1931, 1987, 2008, and 2020.
It should be noted that data in VIX only dates back to the 1990s because the VIX didn’t officially start trading until 1993. Conveniently, the figures used to calculate the VIX have always been there—meaning that even if the VIX didn’t exist, it’s still possible to estimate where it would have been trading at (as shown above).
In the last several weeks, tastytrade has conducted extensive research on the VIX to uncover fresh insights on how a global crisis can impact options pricing and trading—especially when the VIX is unusually high (>80).
As shown below, broad-market equity indexes such as the S&P 500 are historically inversely correlated with the VIX. This is because as equities prices rise, the perceived risk in the marketplace tends to decline.
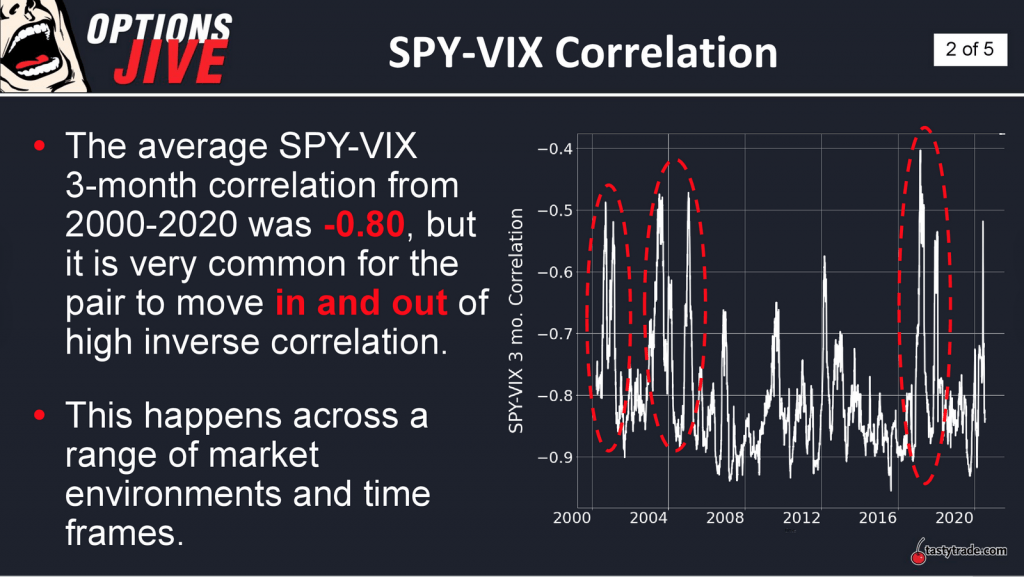
The exception to the above includes those rare instances when stock prices and the VIX move in the same direction.
According to recent tastytrade research, the probability of the S&P 500 and the VIX moving in the same direction is highest when the VIX is trading between 30 and 40, as shown below.
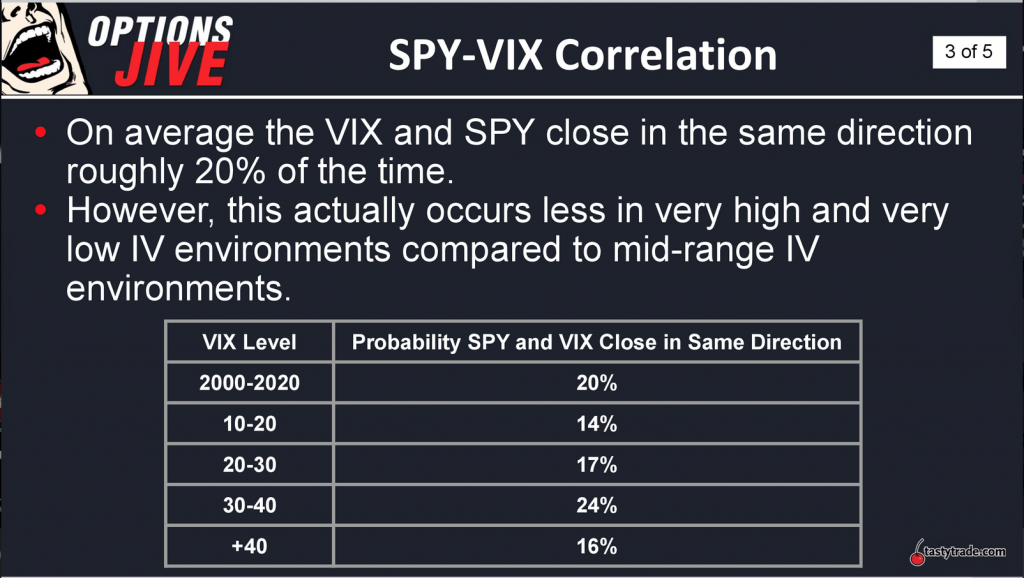
Ostensibly, the above behavior is likely due to the fact that when the VIX is between 30 and 40, market participants remain unsure whether volatility is contracting or expanding. So a big move up in the stock market is perceived as a continuation of uncertainty because it could easily reverse soon after, which is why the VIX can rise in such a situation.
Historically, the range in VIX has been between about 9 and 83, with a median of 19. The fact that the median lies much closer to the lower boundary in the VIX indicates that it spends considerably more time trading below 40 than above it.
Moreover, as pointed out previously, an 80 print in VIX is fairly rare—occurring in only five trading years of the last 92.
The above means that when the VIX is trading at extremes—especially at the upper end of its range—traders need to be particularly cognizant of the outlying nature of those occurrences. During these periods risks in the marketplace are extremely high, as are potential rewards.
The intensity of volatility in these rare situations furthermore suggests that traders may need to adjust their mindset, particularly as it relates to new positions and overall portfolio risk management.
For example, many traders use Implied Volatility Rank (aka IV Rank or IVR) to ascertain whether implied volatility is relatively expensive, fair or cheap. But IV Rank is calculated using the last 52 weeks of data, which means that outlier data in the 52-week data set can potentially skew how the rankings are interpreted and used.
If implied volatility in hypothetical stock XYZ ranged between 20 and 40 during the 2019 trading year, that would mean that an implied volatility of 40 would equate to an IV Rank of 100%. Volatility traders often seek IV Ranks above 50% when filtering for short premium opportunities.
Now imagine that at the start of 2020, implied volatility in XYZ rallied to 60 during the VIX spike to 80+. That in turn means the 52-week range for implied volatility in XYZ would change to between 20 and 60. So now, a 100% IV Rank would equate to 60 implied volatility instead of 40.
In this scenario, traders filtering for IV Rank opportunities greater than 50% would no longer uncover XYZ in their sorting process. This is where an adjustment to one’s mindset and approach may be necessary.
If a trader believes that the uncertainty which pushed the VIX above 80 has been resolved, they might also believe that 60 implied volatility in XYZ is an outlier. In that case, they might feel comfortable excluding the outlying data from their evaluation process. Otherwise, IVR data has less utility, because the 52-week data set includes a record high in VIX, which skews all IV ranks lower.
The same could also be said of the reverse situation—if implied volatility were to become unusually compressed. In these conditions, imagine the range in implied volatility for XYZ dropping from between 20 and 40 to between 10 and 20.
A trader may not feel compelled to get short implied volatility at 20 because in “normal” trading conditions that figure previously represented the lower boundary of implied volatility. That’s a dangerous proposition if things revert to “normal.”
It’s that difficulty in pricing extremes—whether it be record highs or record lows—that helps explain why many traders reduce their size in such markets, or temporarily exit altogether.
For more insight on trading extremes in the VIX, readers may want to review a recent episode of Options Jive on the tastytrade financial network when scheduling allows.
To learn more about how 2020 compares to 2008, this previous episode of Market Measures is also recommended.
“Sage Anderson” is a pseudonym for a contributor who has traded equity derivatives and managed volatility-based portfolios as a prop trading firm employee. He is not an employee of Luckbox, tastytrade or any affiliated company. Readers may direct questions about this blog post, or any other trading-related subject, to support@luckboxmagazine.com.