Trading Gold as a Proxy for Fear

Trading China’s Coronavirus (Part 11)
Coronavirus Updates:
- The estimated number of total global coronavirus infections has risen to more than 95,334 with at least 3,285 associated fatalities
- Approximately 273 of the deaths linked to the novel coronavirus have occurred outside of mainland China across 14 countries
- There are currently 158 confirmed cases of COVID-19 in the United States (11 fatalities)
- Intensifying outbreaks in Iran, Italy, and South Korea have added to growing worries over the global spread of COVID-19
- Volatility in international stock market indexes has picked up significantly in recent days, with the VIX climbing as high as 49 on Feb. 28
- The Centers for Disease Control and Prevention (CDC) recently broadened guidelines for testing the coronavirus in the U.S., expanded to include anyone with symptoms
- U.S. lawmakers recently earmarked $8.3 billion in funds to combat the spread of the coronavirus
- California, Florida and Washinton each declared states of emergency due to the spread of the coronavirus
- A medical screener at Los Angeles International Airport (LAX) recently tested positive for COVID-19
- A cruise ship returning to port in California is being held offshore until passengers are screened for the virus
- The World Health Organization (WHO) recently announced that the coronavirus is more deadly than the seasonal flu, but may not transmit as easily
- The site associated with the original COVID-19 outbreak, the Wuhan Seafood Market, is expected to be demolished
With the global spread of the coronavirus picking up speed in recent days, many of the world’s central banks have assumed “accommodative” posturing to help soothe growing anxieties over a slowing global economy and falling stock markets.
On Tuesday, the U.S. central bank shouldered their best-known weapon and fired the so-called “bazooka” by cutting the federal funds rate a half percentage point. In his public remarks, the nation’s top central banker, Jerome Powell, indicated that the action could do little to stop new infections of the coronavirus, but that the rate cut was intended to assist the economy in a time of potential distress.
One notable aspect of the rate cut was that it was conducted on an emergency basis—meaning the group was convened outside their normal schedule and decided to make a move ahead of their upcoming meeting on March 17-18. This represents the first emergency cut to the federal funds rate since the financial crisis in 2008-2009.
The response in the financial markets Tuesday was a little topsy-turvy, as the major stock indexes rode an up-and-down roller coaster before ultimately plunging into the close. After a widespread rally a day earlier, the retracement on Tuesday saw most of the major averages close back toward the lows observed last week.
Then, on Wednesday, equity prices jumped back on the elevator and punched the “penthouse” button, erasing the down move from Tuesday.
After climbing nearly 1,200 points Wednesday, the Dow Jones Industrial Average clawed back out of “correction territory,” and is now only 8% off the all-time high it hit in mid-February.
Given the big swings observed in the major stock market indexes during the first three days of this week, there’s no telling where the averages might close come Friday.
Regardless, another big winner to highlight this week is the precious metals space—particularly gold.
Gold prices rallied 3% on Tuesday, and are now up about 26% since last summer. Gold currently trades for right around $1,650/ounce. The all-time closing high in gold is north of $1,900/ounce, and was set in 2011.
An important thing to keep in mind is that gold is priced in U.S. dollars.
This is important because when a sovereign nation such as the United States drops interest rates (like it did this week), that can often translate to a lower currency valuation. That also means after a rate cut that more dollars are theoretically required to purchase the same amount of gold as compared to before the rate cut.
As gold gets “cheaper” relative to the U.S. dollar, that can in turn catalyze increased demand for the metal. Assuming no change in supply, one can see how this situation creates a “perfect storm” in which gold can build positive momentum due to a variety of different factors.
Traditionally, gold is also perceived to be a “safe haven” or “fear gauge” in the financial markets, much like a canary in a coal mine. However, according to new research conducted by tastytrade, that viewpoint may not be completely accurate.
As one can see in the graphic below, the correlation between the S&P 500 and gold prices since 2010 has been close to zero:
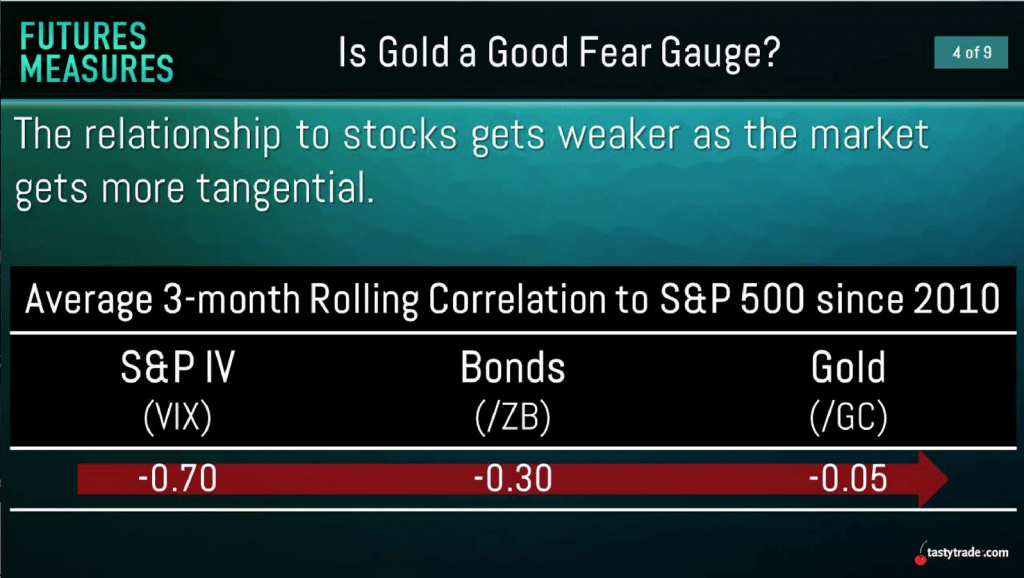
If gold prices were consistently rising whenever the stock market was selling off (e.g. “fear gauge”), then the correlation between the S&P 500 and gold would indicate a strong, inverse correlation. As one can see above, that isn’t the case.
A closer look at the above data, breaking down historical performance in the S&P 500 into “up” days and “down” days, reconfirms the lack of a strong relationship between the S&P 500 and gold. The slide below illustrates that even when the S&P 500 has sold off more than 2%, gold prices still have not exhibited a strong correlation with the stock market.
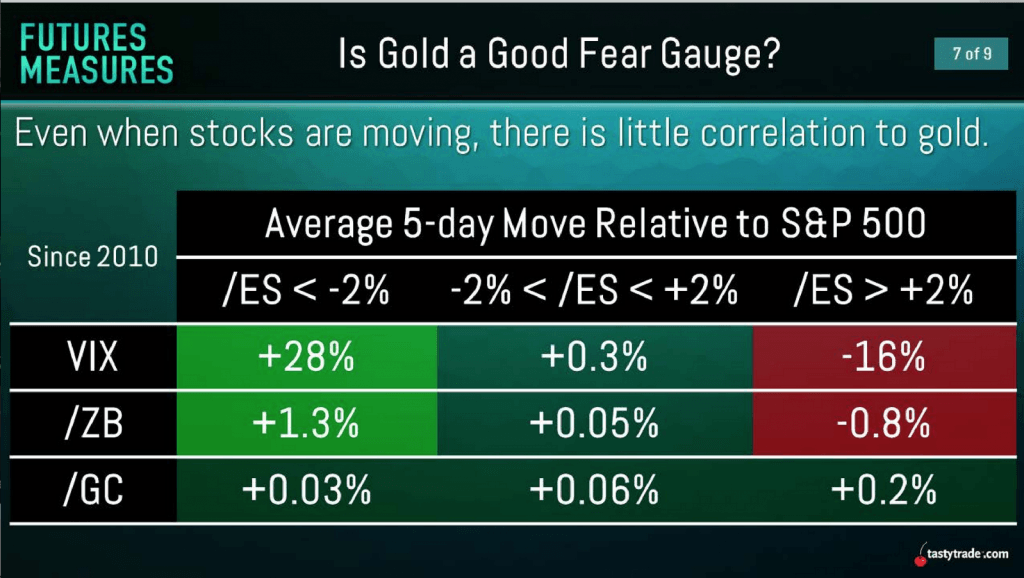
As one can see in the bottom row of the chart, and in the far left column, gold prices have shown little tendency to rally when the S&P is dropping. On the other hand, the research does show that the VIX exhibits a strong, inverse correlation with the S&P 500, and tends to rally when the S&P is selling off.
So what is gold highly correlated with?
As it turns out, movement in gold prices appears to be more sensitive to demand and supply dynamics, as opposed to a specific “safe haven” trade in the financial markets.
And there’s one group in particular that has huge influence over the direction of gold prices on any given day: sovereign central banks.
The key is that central banks typically maintain vast gold reserves which are actively managed (increased or decreased) at different points in time for a variety of different reasons. And when central banks add to their gold reserves, the associated increase in demand (assuming no change in supply) can have a big impact on the underlying price of gold.
Interestingly, central banks tend to add to gold reserves when uncertainty in the global economy and/or financial markets is rising. Given the timing of this type of intervention, it’s easier to see why gold is often perceived as a “safe haven,” despite the lack of a strong correlation with plunging stock markets.
In terms of gold correlations, it should further be noted that gold shares a strong correlation with other products in the precious metals space. For example, gold and silver share an extremely strong, positive historical correlation of about 0.89.
Due to their longtime link, many traders use the gold-silver ratio as an indicator of the relative value of each, and as a potential trading signal.
As a reminder, the gold-silver ratio is calculated by simply taking the price per ounce of gold and dividing it by the price per ounce of silver. The quotient of that equation reports how many ounces of silver are required to buy a single ounce of gold at a given point in time.
For example, at the start of 2019, when gold was trading for roughly $1,283/ounce, and silver was trading for $15.70/ounce, that meant approximately 82 ounces of silver were required to purchase a single ounce of gold.
When gold prices left silver prices in the dust last summer, the gold-silver ratio climbed to a roughly 30-year high, at about 93. Silver prices did eventually catch up to gold, pushing the ratio back down to 80 by September of 2019.
Currently, the gold-silver ratio is trading about 95, which means it has rallied back toward all-time highs—a development traders may want to monitor more closely in the coming days.
Traditionally, pairs traders sell gold and purchase silver when the gold-silver ratio reaches the higher end of its range. Such a position theoretically benefits from a drop in the ratio—which requires gold to go lower, silver to go higher, or both.
Traders can also take naked directional positions in gold and silver, or even trade precious metals volatility using ETFs and futures options.
For more information on why gold may not be the best “fear gauge,” readers are encouraged to review a recent installment of Futures Measures on the tastytrade financial network when scheduling allows. To learn about products specifically designed to report on market fear, such as the VIX, further reading is available here.
Those looking to follow play-by-play action in the financial markets can also tune into TASTYTRADE LIVE Monday through Friday from 7:00am to 3:00pm central time.
Sage Anderson is a pseudonym. The contributor has an extensive background in trading equity derivatives and managing volatility-based portfolios as a former prop trading firm employee. The contributor is not an employee of Luckbox, tastytrade or any affiliated companies. Readers can direct questions about topics covered in this blog post, or any other trading-related subject, to support@luckboxmagazine.com.