Trading the Yield Curve’s Latest Inversion with U.S. Treasury Yields
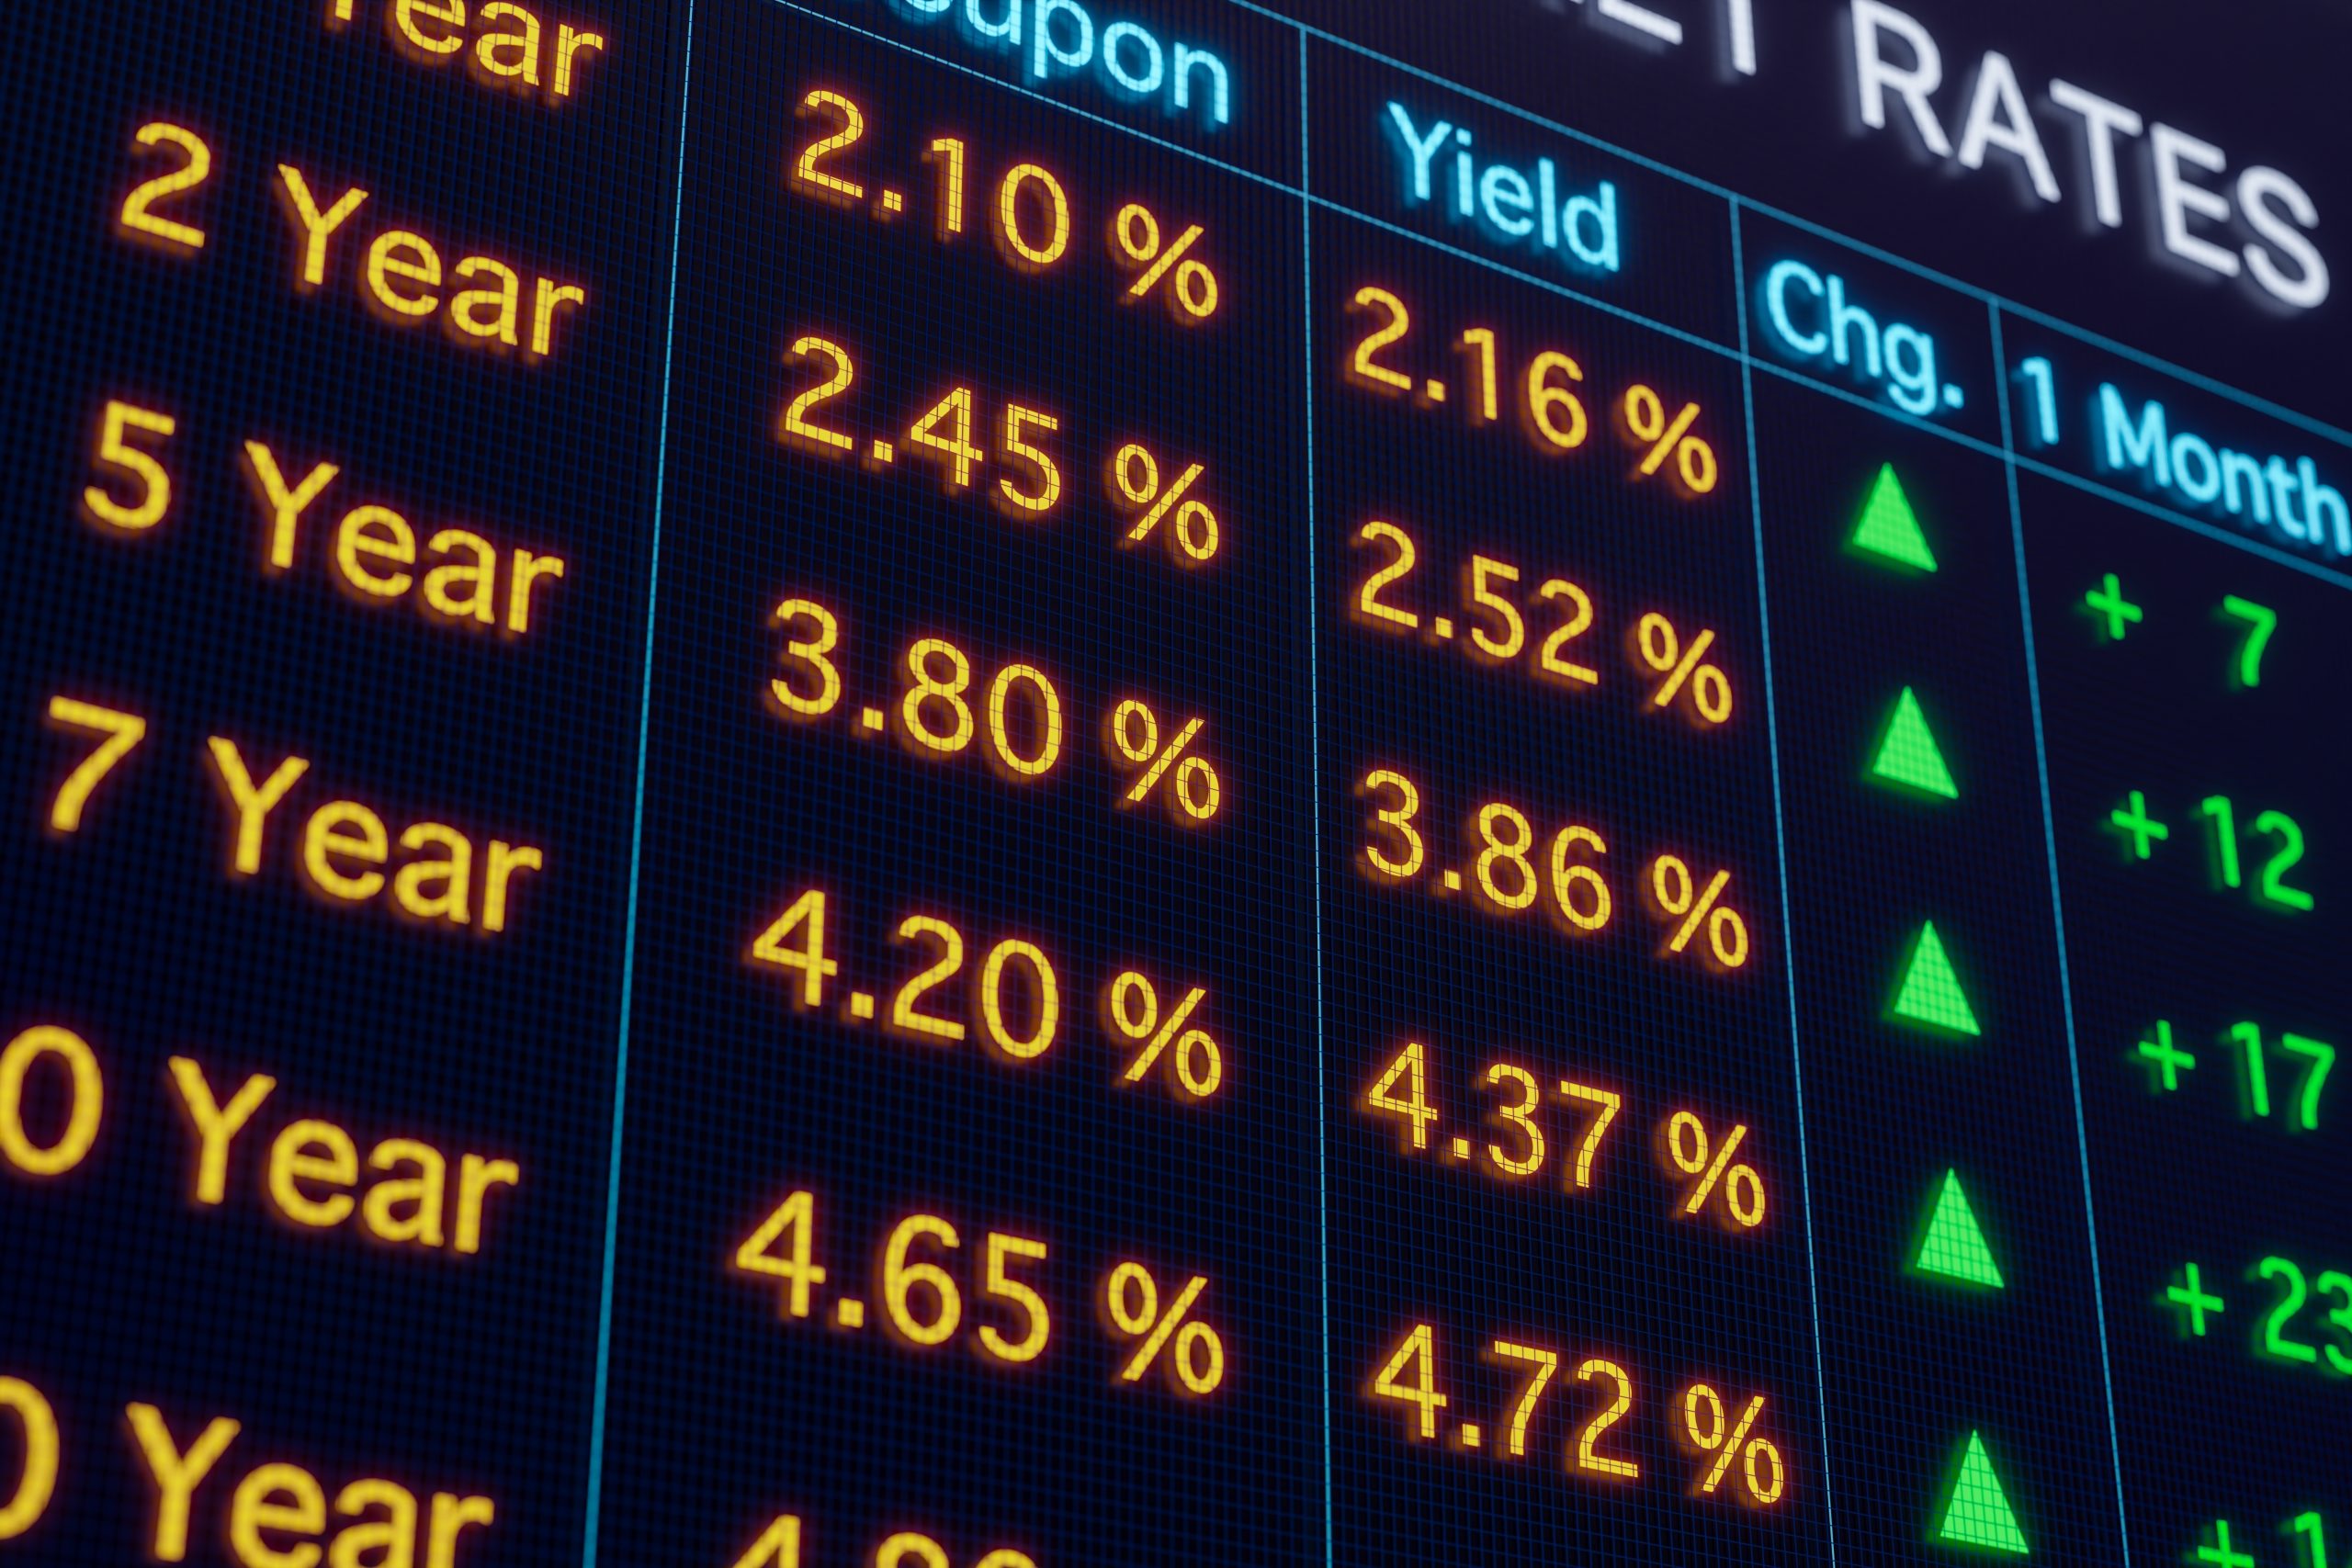
The yield on the 2-year U.S. Treasury is currently 3.27%, while the yield on the 10-year U.S. Treasury is 2.82%, representing a multi-decade extreme in the relationship between the two.

The COVID-19 pandemic has made everything more complicated, including economic modeling.
It’s not exactly easy to project how a once-in-a-generation global health crisis will impact the economy. Nor is it easy to project how the global economy will perform moving forward, especially with many of the world’s largest central banks now tightening their respective monetary policies.
Today, it’s even difficult to determine whether the U.S. economy is already in recession.
Traditionally, a recession is defined as two consecutive quarters of negative GDP growth. According to that definition, the U.S. economy officially entered a recession at the start of Q3, because Q1 and Q2 of 2022 both saw declines in GDP growth.
However, the current jobs market has not confirmed that a recession has taken hold in the country. The U.S. unemployment rate is holding steady at 3.5%, which is the lowest level observed in the last 50 years. Moreover, the July hiring report was quite robust, indicating that employers in the U.S. added roughly 528,000 new jobs in July 2022.
Previous recessions and depressions in the U.S. have been accompanied by a severe slowdown in hiring, as well as large swaths of layoffs. In fact, a lack of available work has been a hallmark of virtually every economic contraction in U.S. history.
Considering the robust nature of the current jobs market, the above suggests that if an economic slowdown is playing out, it’s likely more attributable to inflation (i.e. a cost of living crisis) as opposed to a lack of available employment.
That said, there is a well-known recession indicator that’s been flashing red for several weeks, which could mean that the real recession still lies ahead. That indicator involves the yield curve—specifically an inversion of the 2-year and 10-year U.S. Treasury yields.
Inversions involving the “2s and 10s” have precipitated the last three major recessions in the U.S. (not including the pandemic-induced recession of 2020).

Going back to the 1990s, all of the most recent recessions were foreshadowed by a 2s and 10s yield curve inversion. And while historical performance (or a historical pattern) is no guarantee of future performance, this is an important development.
At present, the yield on the 2-year U.S. Treasury is 3.27%, while the yield on the 10-year U.S. Treasury is 2.82% The severity of the inverse spread between the two—45 basis points—represents a multi-decade extreme in the relationship between these two well-known government bond yields.
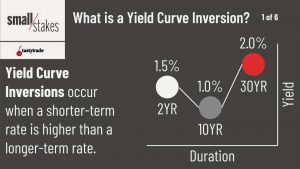
What’s a Yield Curve Inversion?
The yield curve represents a timeline of interest rates across a range of different maturities and is typically presented in chart form.
A normal yield curve is usually described by a gradually rising line going from left to right on the chart—meaning interest rates rise as one goes further out in time. On the other hand, a so-called “inversion” of the yield curve occurs when short-term rates climb higher than longer-term rates—even if only for a brief period.
Generally speaking, longer-term interest rates reflect future expectations for short-term interest rates. So when long-term rates drop below short-term rates, that generally means that future expectations for the underlying economy are deteriorating, as highlighted in the graphic below.
The U.S. central bank (the Federal Reserve System) is currently in the middle of an aggressive campaign to raise interest rates in the U.S.—ostensibly to help fight inflation. Unfortunately, rising interest rates make home loans, car loans, and pretty much every other type of loan, more expensive. Rising financing costs aren’t generally a positive for consumers or businesses.
At some point, the bite of higher financing costs will likely be too much for the American economy to bear—at which point, the Federal Reserve will be forced to stop raising benchmark rates. Less disposable income (as a result of higher financing costs) means less consumption. It’s that tightening of the belt by consumers and businesses that could ultimately push the economy into recession at some point.
Yield curve inversions involving the 2s and 10s have been fairly accurate in predicting recessions. The big question is whether this economic contraction will be mild or severe.
Considering that the jobs market is still robust, it could be some time before economists are able to sort out exactly what’s happening in the underlying economy in 2022.
One potential outcome is hindsight reveals that the U.S. economy dipped slightly during the first half of 2022 due to the “cost of living crisis,” and then quickly rebounded. Another possibility is that a sharper economic contraction still lies ahead—the worst of which hasn’t appeared on the radar yet.
Readers seeking to learn more about the yield curve can check out this episode of Options Jive on the tastytrade financial network. For more background on the yields trade, watch this installment of Small Stakes.
To follow everything moving the financial markets on a daily basis, tune into TASTYTRADE LIVE—weekdays from 7 a.m. to 4 p.m. CDT.
Sage Anderson is a pseudonym. He’s an experienced trader of equity derivatives and has managed volatility-based portfolios as a former prop trading firm employee. He’s not an employee of Luckbox, tastytrade or any affiliated companies. Readers can direct questions about this blog or other trading-related subjects, to support@luckboxmagazine.com.