What Every Investor Needs to Know About the Average Length of a Bear Market
Going back to 1957, the average length of the previous 15 bear markets was 338 days, but in the 21st century, bear markets have gotten progressively shorter.

Bear markets get their nickname from the downward swiping action of an attacking bear. Accordingly, bull markets are dubbed as such due to the upward thrust of an attacking bull’s horns.
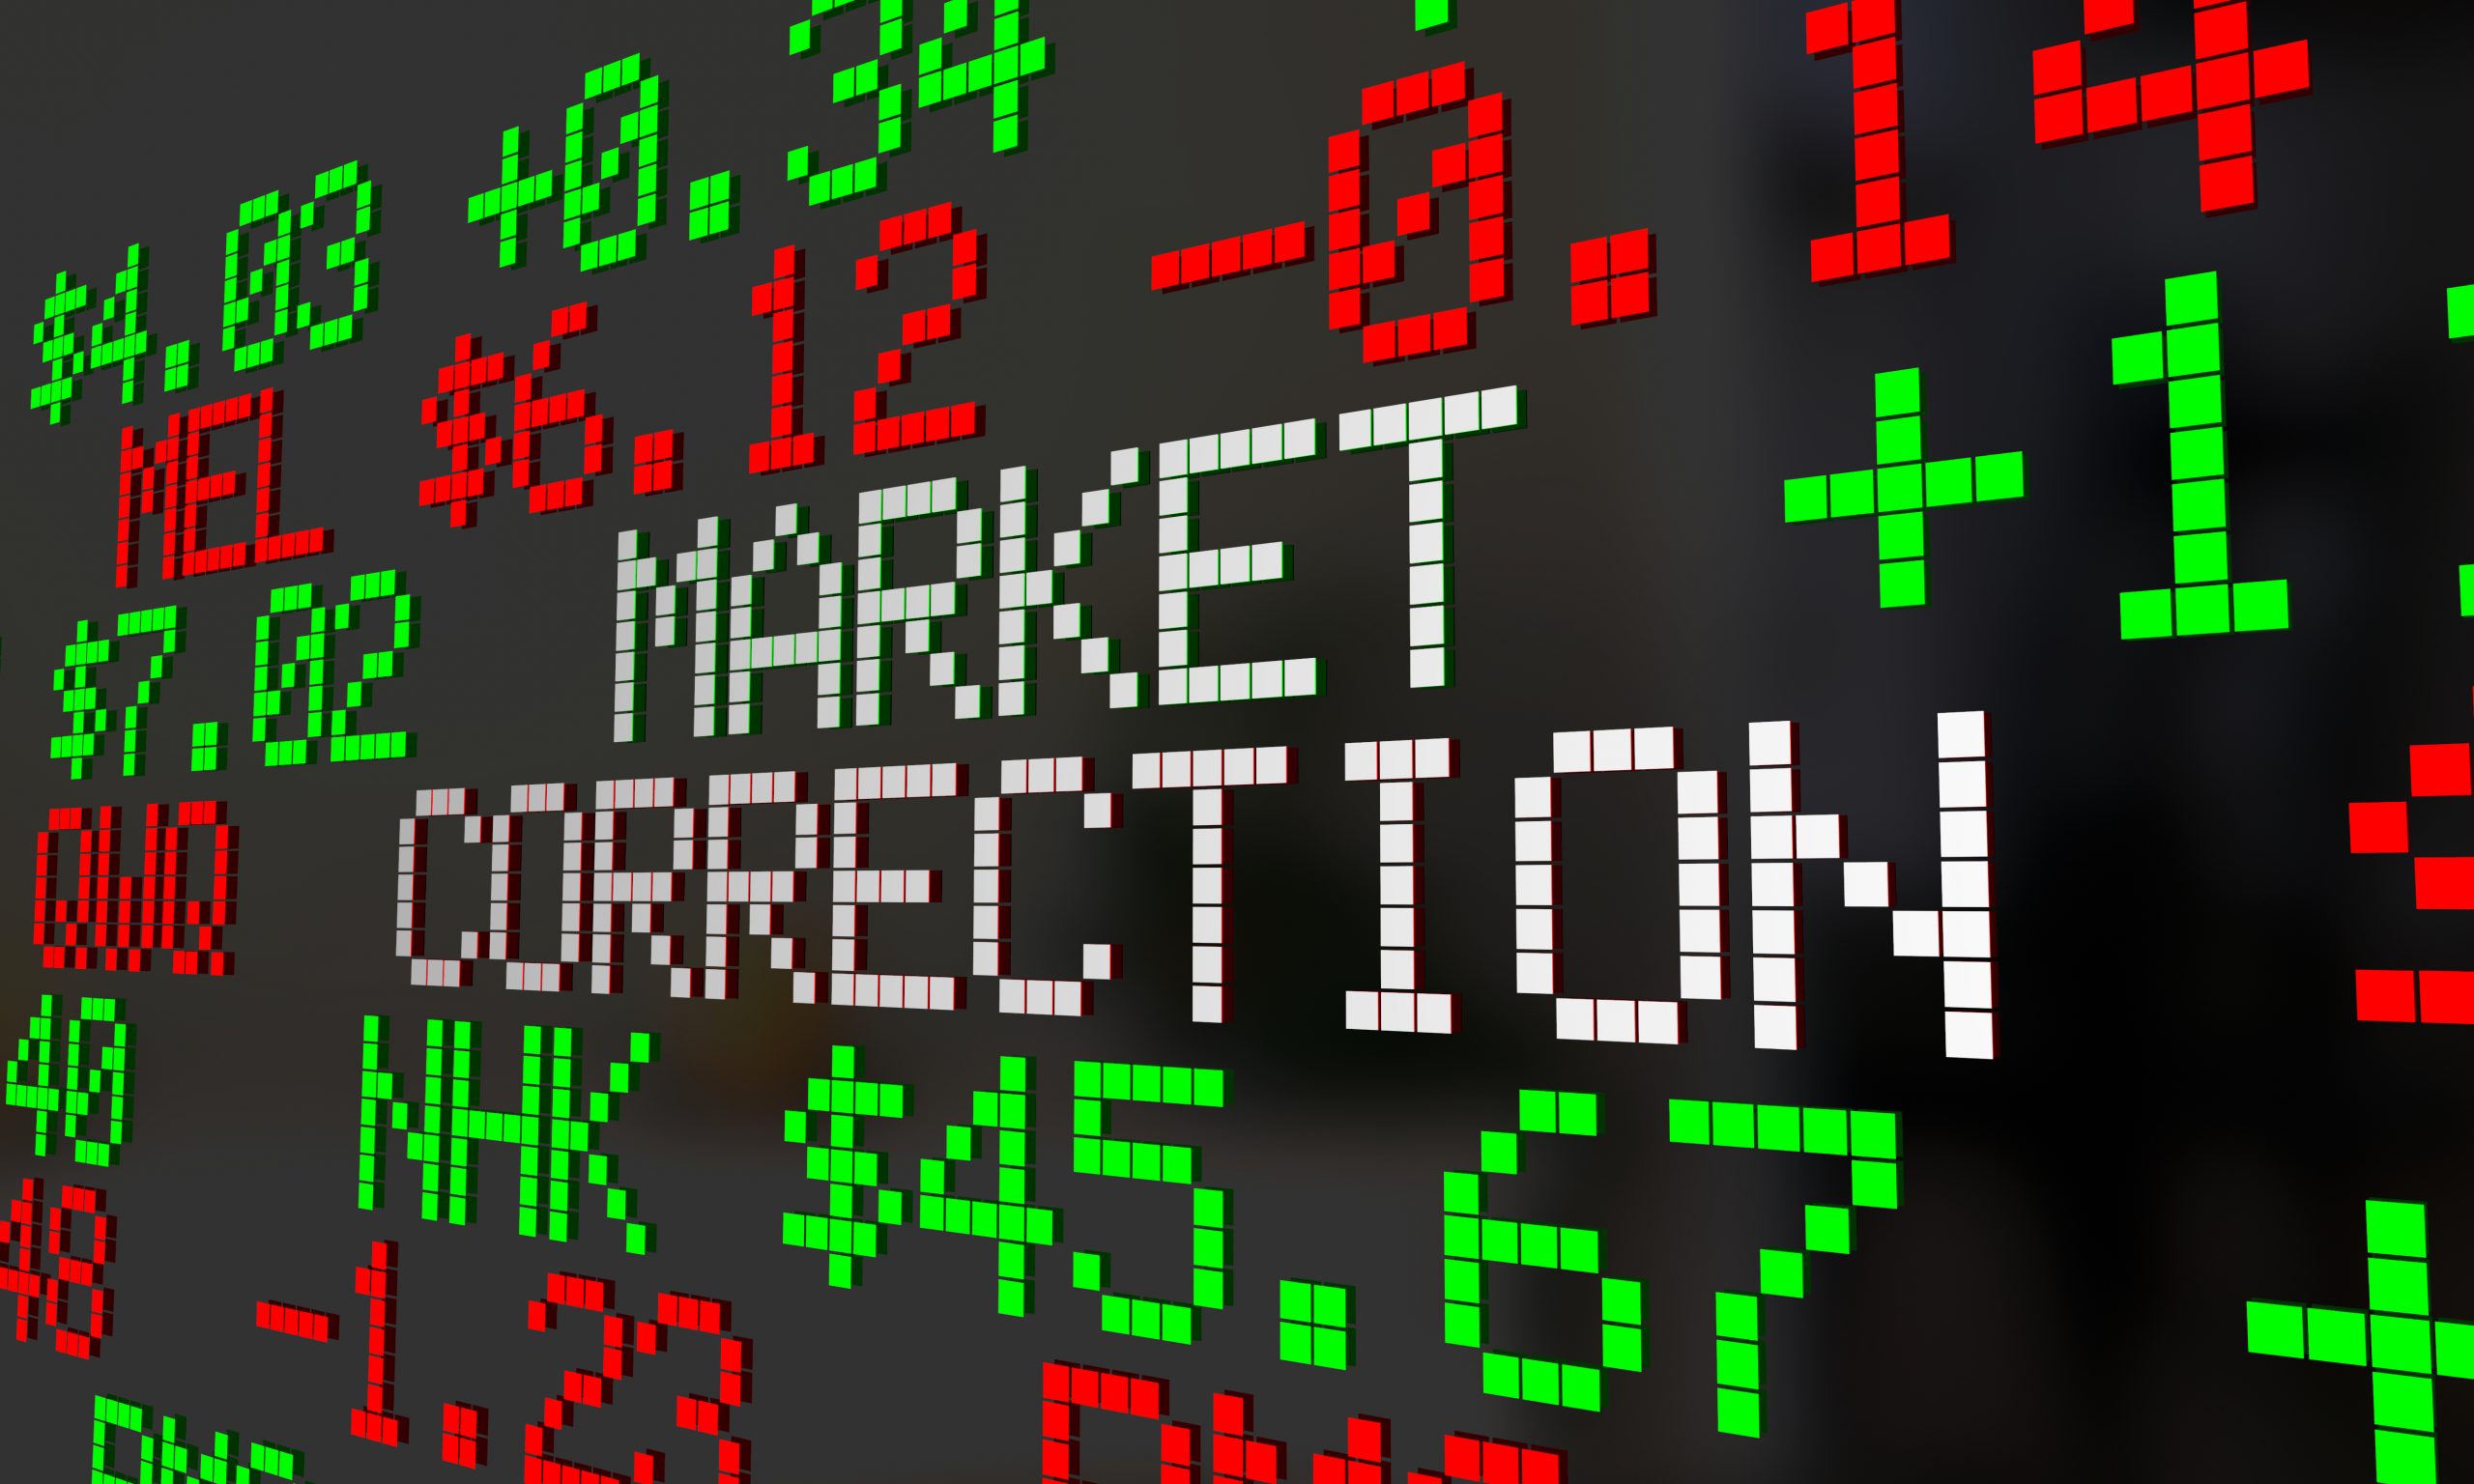
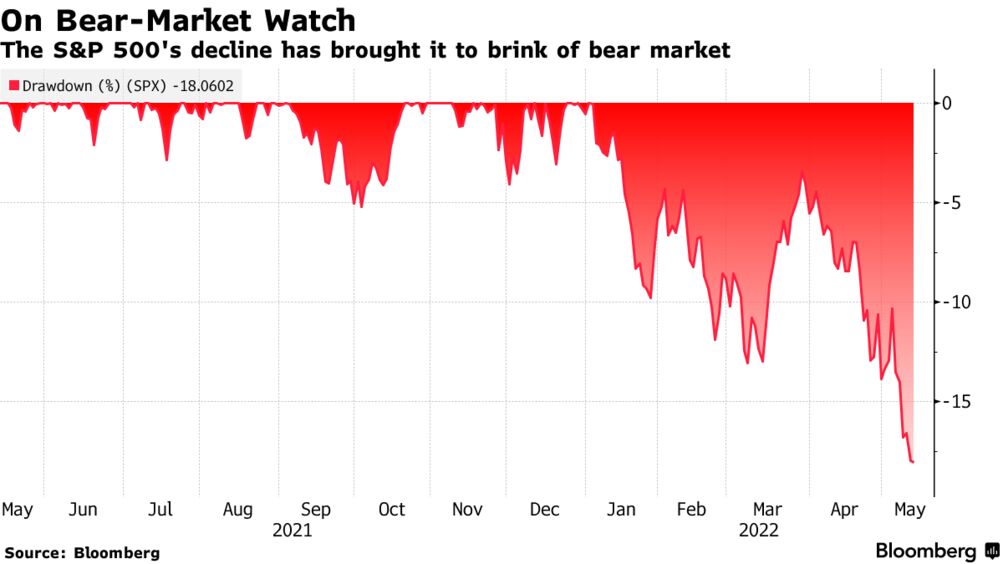
Bear markets are typically defined as market corrections in which the major market indexes decline by at least 20%. As most are well aware, the major market indexes have struggled mightily in 2022, with the Nasdaq Composite officially entering bear market territory on March 7. The S&P 500 lagged the Nasdaq Composite and didn’t dip into bear market territory until May 20.
Due to the aforementioned market weakness, many investors and traders are likely asking themselves how long the suffering might last.
The good news is that during the 21st century, bear markets have been shorter, on average, than bear markets observed during the previous 50 years. And interestingly, each of the last four bear markets (since the year 2000) has gotten progressively shorter.
So far in the 20th century, the S&P 500 has entered bear market territory on four different occasions: 2000, 2007, 2020 and 2022. Notably, however, there have also been two instances in which the S&P 500 corrected by 19% during that period—just outside the technical definition of a bear market but nonetheless significant.
The chart below lists all the corrections of 19% or more in the S&P 500 going back to 1950, and it highlights how the length of each bear market since the year 2000 has gotten progressively shorter.

As shown above, it took the bear market starting in March of 2000 a total of 929 days to rebound back to breakeven. However, during the ensuing four market corrections, the length of each bear market proceeded to shrink—from 517 days during the 2007-2009 Great Recession, all the way down to 33 days during the COVID-19-induced market correction in 2020.
Considering that 2020 saw the quickest rebound in history, one would think that it would be difficult for the market to bounce back in a shorter time than 33 days during the current market pullback.
However, if the recent pattern holds, it’s reasonable to think the market could rebound back to breakeven within 33 to 157 days.
Alternatively, one could use the longer-term average as a guideline for how long the current market downturn could last. Going back to 1957, the average length of the previous 15 bear markets (of 19% or more) was 338 days, or roughly 11 months.
Obviously, historical performance is no guarantee of future returns. And it’s possible that the current market pullback gets more intense—possibly a lot more intense—before the rebound takes hold.
Looking all the way back to the origins of the stock market, there have been a total of 26 bear markets and 27 bull markets. Those stats suggest that another bull market will develop at some point in the future. Whether that’s 30 days from now, 150 days from now or 900 days from now is the big unknown.
Investors and traders may want to develop a game plan for several different scenarios. That way, one of those plans can be executed in systematic fashion, as opposed to utilizing knee-jerk, emotional responses—the latter of which can be risky in fast-moving markets.
To follow everything moving the markets this summer, readers can tune into TASTYTRADE LIVE at their convenience.
For more context on the current stock market correction, readers can watch the episode of Truth or Skepticism with tastytrade co-founder Tom Sosnoff, below.
Get Luckbox! Subscribe to receive 10-issues of Luckbox in print! See SUBSCRIBE or UPGRADE TO PRINT (upper right) for more info or visit getluckbox.com.
Sage Anderson is a pseudonym. He’s an experienced trader of equity derivatives and has managed volatility-based portfolios as a former prop trading firm employee. He’s not an employee of Luckbox, tastytrade or any affiliated companies. Readers can direct questions about this blog or other trading-related subjects, to support@luckboxmagazine.com.