The Yield Curve Inversion: What You Need to Know
The U.S. yield curve inverted at the end of October, and while that may be a notable development, it doesn’t necessarily indicate that a recession in the U.S. economy will materialize anytime soon.

With the holidays approaching, nobody wants to think about the dreaded “R” word. And certainly not the “D” word.
But recent developments in the financial markets can’t be ignored, which is why the possibility of another recession—somewhere down the line—has to be considered.
Of course, with the U.S. economy currently rebounding from the COVID-19 pandemic, and the Federal Reserve poised to raise benchmark interest rates, one might reasonably wonder how the risk of recession is even on the radar.
The answer ties back to the yield curve, which not only highlights short-term interest rates (i.e. rates controlled by the Fed), but also medium-term, and longer-term rates. The yield curve essentially plots the yields on all Treasury maturities—debt sold by the federal government—ranging from one-month bills to 30-year bonds.
And it’s the latter part of the yield curve, encompassing 20-year and 30-year government bonds, that recently became a subject of concern. The issue is that the yield on the 20-year U.S. Treasury bond recently climbed higher than the yield on the 30-year U.S. Treasury bond, as illustrated below.

The above is slightly abnormal because interest rates generally rise as one moves further out on the yield curve. Normally it’s an arcing, upward slope because bond investors expect to be compensated for taking on the added risk of owning bonds with longer maturities.
So when the yield curve flattens, economists start getting worried. And when the yield curve inverts, those concerns start to intensify. For context, the yield curve has been flattening since March of this year, and recently inverted at the end of October.
This is a concern because virtually every economic recession/depression in U.S. history has been preceded by a so-called “yield curve inversion.” And with 30-year yields dropping below 20-year yields, it’s become clear that the market is starting to price in the increased possibility of a recession at some point down the line.
The good news, however, is that the inversion (to this point), has been minor. As shown in the chart above, there’s currently only a small gap between the 20-year and 30-year Treasury yields.
Furthermore, previous yield curve inversions—which ultimately snowballed into recessions/depressions—were preceded by an inversion in the two-year and 10-year Treasury products. And, as illustrated below, an inversion in those products hasn’t yet been observed in 2021.
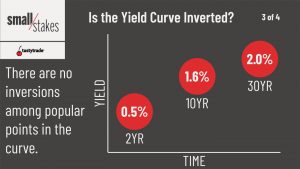
Taken together, that means investors and traders may want to monitor the yield curve closely in the coming weeks. While the current inversion may not represent a major concern, one has to keep in mind that market conditions, as well as sentiment/expectations, can change in a hurry.
To learn more about the recent yield curve inversion, readers are encouraged to review a new installment of Small Stakes on the tastytrade financial network.
More information about trading yields can also be found on this previous installment of Market Measures.
For timely insights on everything moving the markets, readers can also tune into TASTYTRADE LIVE—weekdays from 7 a.m. to 4 p.m. CST—at their convenience.
Sage Anderson is a pseudonym. He’s an experienced trader of equity derivatives and has managed volatility-based portfolios as a former prop trading firm employee. He’s not an employee of Luckbox, tastytrade or any affiliated companies. Readers can direct questions about this blog or other trading-related subjects, to support@luckboxmagazine.com.