Now What? Keep Your Head Straight, or Head For the Exits?
The global economic recession following the onset of COVID-19 was nothing short of unprecedented, but the subsequent recovery in U.S. markets was arguably as shocking.
And now this correction.
Let’s look back for a moment.
For example, the S&P 500 took approximately 1,167 trading days (4.6 years) to fully recover from the 49% selloff of the Dot-Com Bubble and 884 trading days (3.5 years) to recover from the 53% selloff of the Great Recession of 2008. Following the COVID Crash of 2020, in which S&P 500 sold off by roughly 34% over 24 trading days, the market skyrocketed to its pre-selloff price after 104 trading days (5 months), approximately. The speed of this market recovery dwarfs those of other major selloffs (see the table below), and has yet to significantly slow.
The S&P 500 has climbed by approximately 90% from the COVID Selloff minimum in late March, meaning that the price of this index has increased by roughly 90% in just over two years. Comparatively, it took just over six years to realize the same amount of growth prior to 2020, as shown in the figure below.
Unlike the Great Recession of 2008, unemployment rate contracted back to its pre-lockdown level nearly as quickly as it expanded in 2020, declining below 4% in under two years following an 18-year high of 14.7% [1]. U.S. real GDP, which declined by a whopping 31% from Q1 to Q2 of 2020, also recovered rapidly, increasing by nearly 34% by the end of Q3 2020 [2].
The U.S. economy has, by several metrics, completely recovered. This was partially due to the legislative response from the federal government, which was more immediate and extensive than in prior crises and recessions. Within weeks of going into lockdown, trillions were allocated to corporate bailouts, small business relief, and badly needed support for individuals, including enhanced unemployment benefits and multiple stimulus checks direct to taxpayers. These measures cushioned the economic impact to businesses, the labor force and consumer spending power.
However, it’s still crucial for retail investors to maintain a healthy amount of exposure to the market at all times, even in the wake of this rapid recovery. For example, the U.S. economy is now reckoning with the long-term complications of the relief measures, as inflation now sits at a 40-year high of 8.5% in the United States. It’s entirely possible that markets will undergo a correction as supply chains restructure, foreign conflicts come to a resolution, and consumer spending habits revert back to usual levels.
The most effective way to protect a portfolio from market turbulence is by maintaining a robust portfolio before markets fly off the handle, similar to how it is much more effective to prevent disease rather than treat someone once they’re already sick. This is best done by keeping positions small and limiting the amount of portfolio capital exposed.
In the case of options portfolios, positions should not occupy more than 5-7% of portfolio capital and the total portfolio allocated to short premium positions should never exceed 50%. Positions should also be well-diversified across companies, sectors and markets so the overall portfolio is less directionally concentrated.
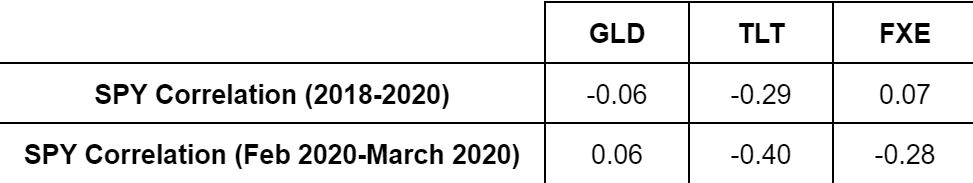
Some examples of good diversifying assets include SPDR Gold Trust (GLD), iShares 20 Plus Year Treasury Bond ETF (TLT) and Invesco CurrencyShares Euro Trust ETF (FXE), as shown in the table below. More details on capital allocation and position sizing for options portfolios can be found in The Unlucky Investor’s Guide to Options Trading.
Julia Spina, a member of the tastytrade research team and author of The Unlucky Investor’s Guide to Options Trading, holds degrees in engineering physics and applied mathematics and a master’s in physics. @financephoton