Disney (DIS) Stock: Past Performance, Trends, and Future Outlook
Its been a tough decade so far for Disney. For a hint of likely future direction, just watch these trendlines

- The company’s performance compared to some of its Dow Industrials peers can be revealing.
- Viewing Disney vs. the S&P 500 shows that over a nearly 60 -year period the company has worked its way through three portions of a technical cycle.
The Walt Disney Company (DIS) went public in 1940 and joined the esteemed ranks of the Dow 30 Industrials in 1991. It’s a household name that was one of the most reliable performers among safe, reliable common stocks until recently.
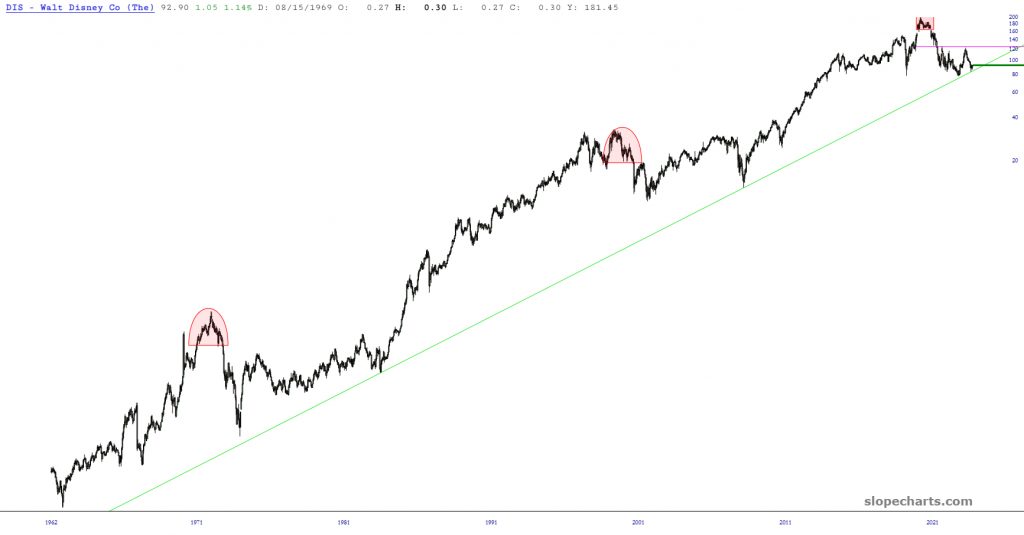
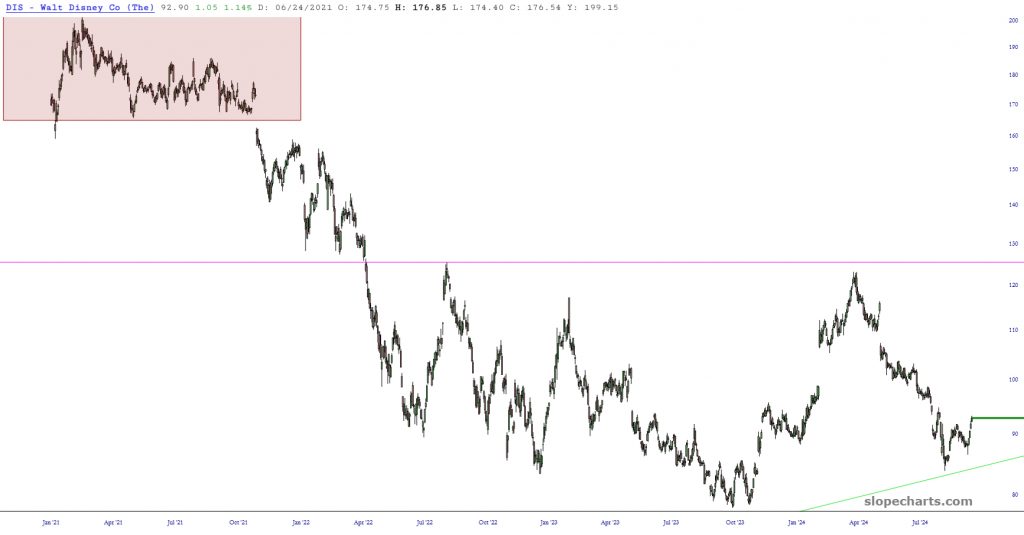
Lately, however, Disney has fallen on hard times. It’s worth less than half what it was nearly four years ago, which in this environment of lifetime highs on major indexes is an abysmal performance. Examining the price bars vs. its lifetime trendline, it can be perceived simultaneously as bargain-priced and also at the cusp of a core, never-before-seen breakdown.
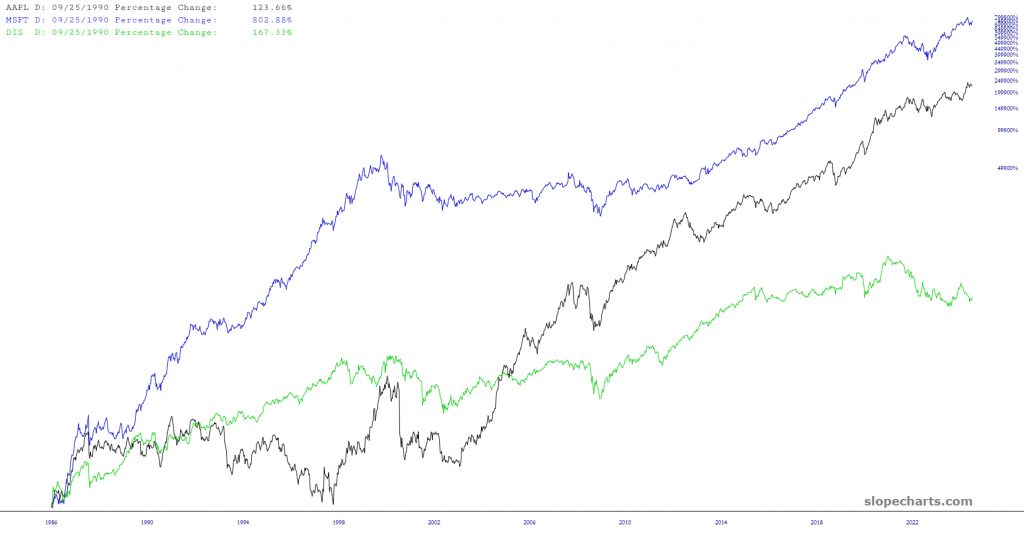
The company’s performance compared to some of its Dow Industrials peers can be revealing. This chart, for example, shows three of the Dow 30 stocks compared to one another in percentage terms. Although the lines don’t seem that far apart, the percentage differences are vast. Among these three stocks—Disney, Microsoft (MSFT) and Apple (AAPL)—Disney is far and away the worst performer, turning in a percentage gain since 1986 of only 1/150th that of Microsoft.
Comparing Disney’s green line with Apple’s black line, we see Disney outperformed Apple in the late 1980s and all of the 1990s. But when the iPod and iPhone took off in the new millennium, Apple surpassed Disney and never looked back.
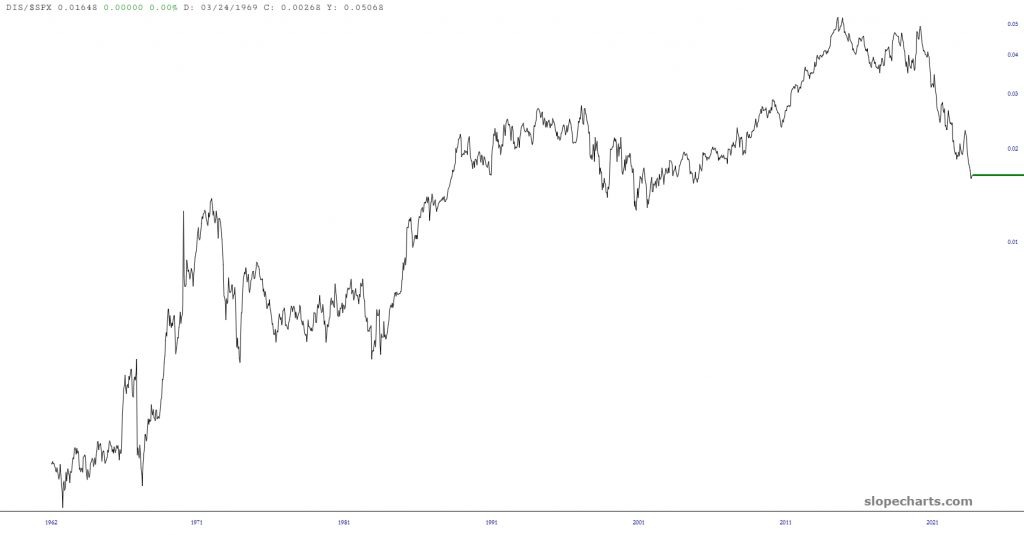
To gain a new perspective on Disney’s performance, compare it to a broad index such as the S&P 500 instead of to high-flying stocks like Microsoft. Below is the ratio chart of Disney divided by the $SPX, which shows the company handsomely outperformed the overall index for many years. It peaked in its relative gains in the first quarter of 2021, with the final flourish probably provided by the influx of streaming content customers during the COVID-19 pandemic.
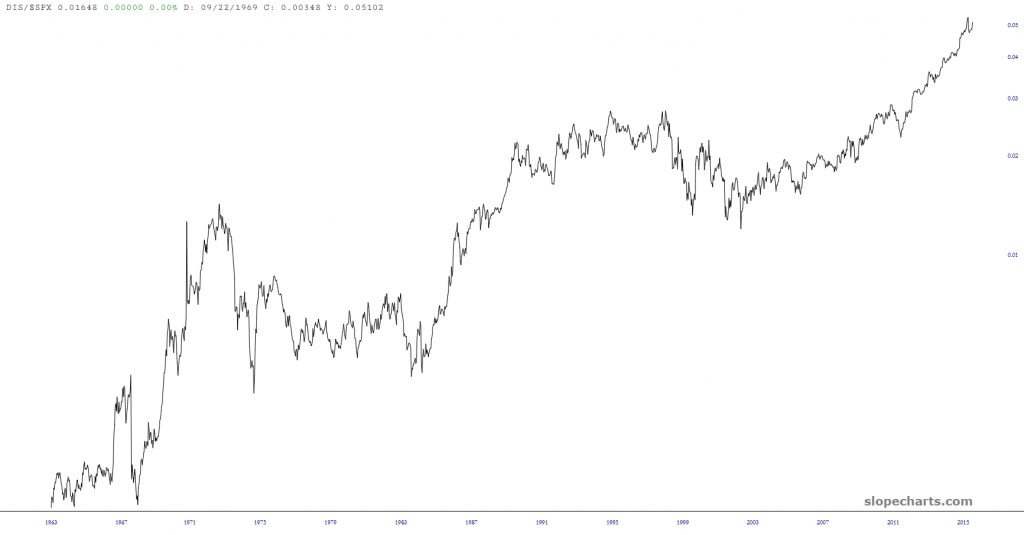
A longer-term comparison of Disney vs. the S&P 500 reveals that over a nearly 60 -year period the company has worked its way through three portions of a cycle: (a) strongly outperforming the index over many years, (b) underperforming for an equally long period of time, and (c) entering a multi-year consolidation before beginning a period of outperformance once more.
At present, it seems Disney is at the end of Phase (b) and perhaps beginning Phase (c), in which the company has broadly corrected its strategy to set itself on the right path to moving into Phase (a) some number of years from now. In other words, Disney will probably perform like the S&P 500 in general for a while before it can shine again—if the past 60 years are any guide.
Looking at recent history, the stock came dangerously close to breaking its lifetime trendline (shown in green). So long as this trendline is respected, the company should continue to stabilize because the past several years have been brutal for the organization.
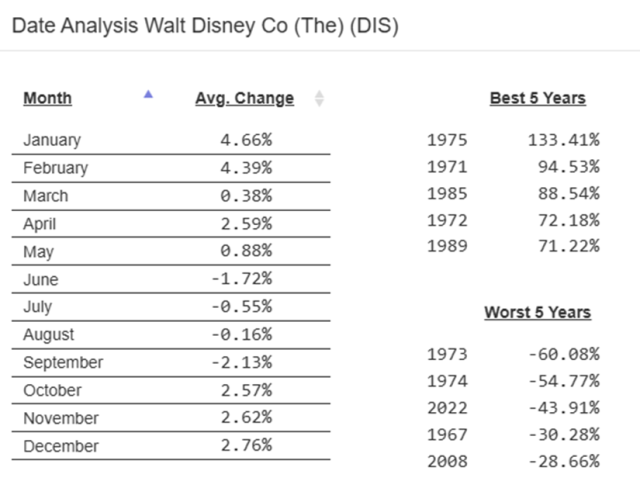
One final table of interest regarding Disney is the date analysis which slopecharts.com performed. This shows the best-performing years (including 1975, which threw off a triple digit gain), the worst performing years and the average performance during each calendar month. For whatever reason, January has been the best time for Disney shareholders, as measured over many decades of data.
Tim Knight, a charting analyst with 35 years of trading experience, hosts Trading Charts, a tastylive segment airing Monday-Friday. He founded slopeofhope.com in 2005 and uses it as the basis of his technical charting and analysis.
For live daily programming, market news and commentary, visit tastylive or the YouTube channels tastylive (for options traders), and tastyliveTrending for stocks, futures, forex & macro.
Trade with a better broker, open a tastytrade account today. tastylive, Inc. and tastytrade, Inc. are separate but affiliated companies.