The Changing Course of Amazon
The world of investing is fraught with uncertainty and disagreement, but one fact remains indisputable: Over the past 100 years, stocks in the United States have generally gone up in price. Pick virtually any stock at random during any point in history, and in all likelihood 10 years later that stock would be higher in price—and perhaps dramatically higher.
Some gains are merely pleasant whereas others are life-changing. One stock that has caused more than its fair share of the latter is Amazon (AMZN), which has risen an unbelievable 200,000% since its initial public offering in 1997. The ride to that jaw-dropping gain was not without its travails, however, and the stock has changed tremendously in dynamics and character during its quarter-century as a publicly traded financial instrument.
Wanted: a functional time machine
On the website slopeofhope.com, users can enter any stock symbol, hypothetical entry date and hypothetical investment amount to see how much such an investment would be worth now. It can be mesmerizing—and often disconcerting—to experiment with different ticker symbols and different dates, playing financial “what if?” games.
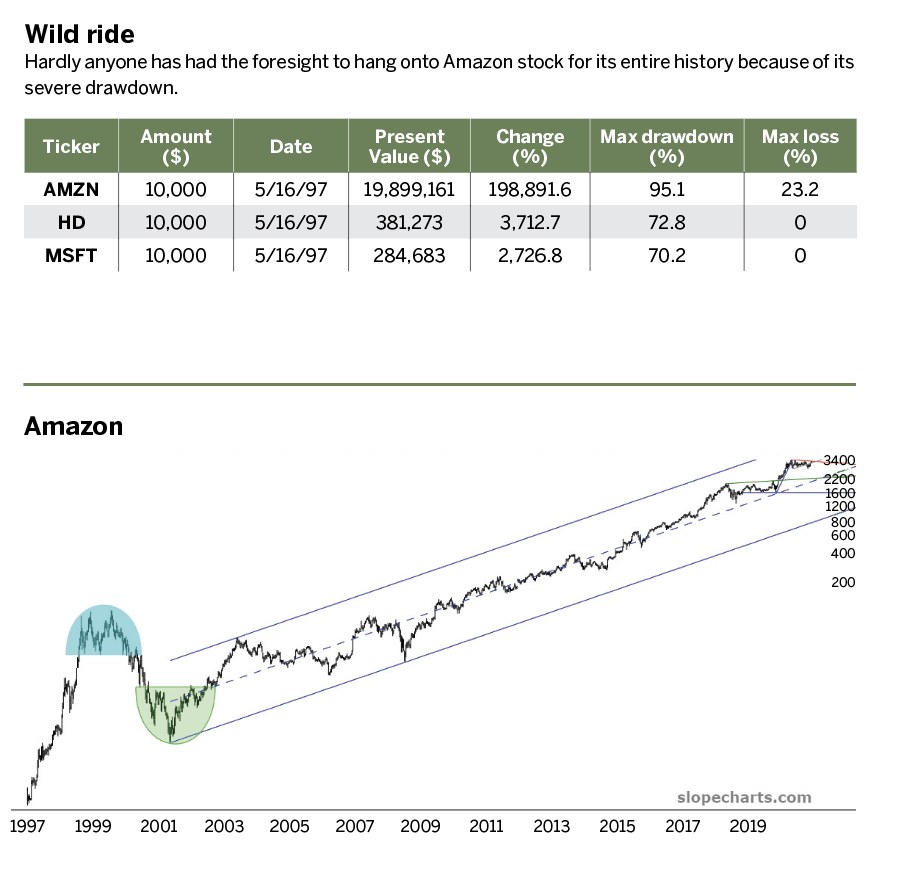
An example is shown here with three popular stocks, each hypothetically purchased on Amazon’s offering date of May 16, 1997. The stocks—Amazon, Home Depot (HD) and Microsoft (MSFT)—have each done well for shareholders over the past quarter-century.
However, these stocks have prospered to greatly varying degrees. Microsoft, clearly one of the greatest stocks of the modern era, gained an impressive 2,746%, turning a modest $10,000 investment into well over a quarter of a million dollars. Home Depot, also a powerful “blue chip” stock for decades, went up even more, turning the same $10,000 outlay into nearly $400,000.
Amazon, however, is in a class of its own. The small $10,000 investment made at the IPO would today be worth about $20 million. A larger but still reasonable investment of $50,000 would be $100 million today. It can make one yearn for a working time machine.
A couple other columns of information are just as important as the gargantuan percentage gains. One is the “Max Drawdown,” and the other is the “Max Loss.”
Max Drawdown represents how deeply a stock declined in value during a period of time. Max Loss calculates, based on the initial investment, the worst possible drop the investment experienced over the same period.
Microsoft and Home Depot, for example, never experienced a loss. In other words, money put into either of these stocks on that date in 1997 would have always shown a profit. Each of them did, however, experience a maximum drawdown of over 70% at some point. In other words, if the value climbed from $10,000 to $100,000, then fell to $30,000, that would be a 70% drawdown. It would be hard to stomach, but at no point would investors have experienced a loss in any of their original capital. They would simply feel “less rich.”
Enduring multiple collapses
Hanging onto Amazon, however, would have taken far more dedication than holding more stable stocks. The maximum loss was nearly 25%, and the maximum drawdown was an eye-watering 95.1%.
In other words, as easy as it is to fantasize about putting a small $10,000 investment into Amazon and becoming fantastically rich in the year 2021, investors would have had to endure a collapse in their holdings of more than 95%. Of 1,000 investors, it would be surprising if even two of them had that kind of willpower.
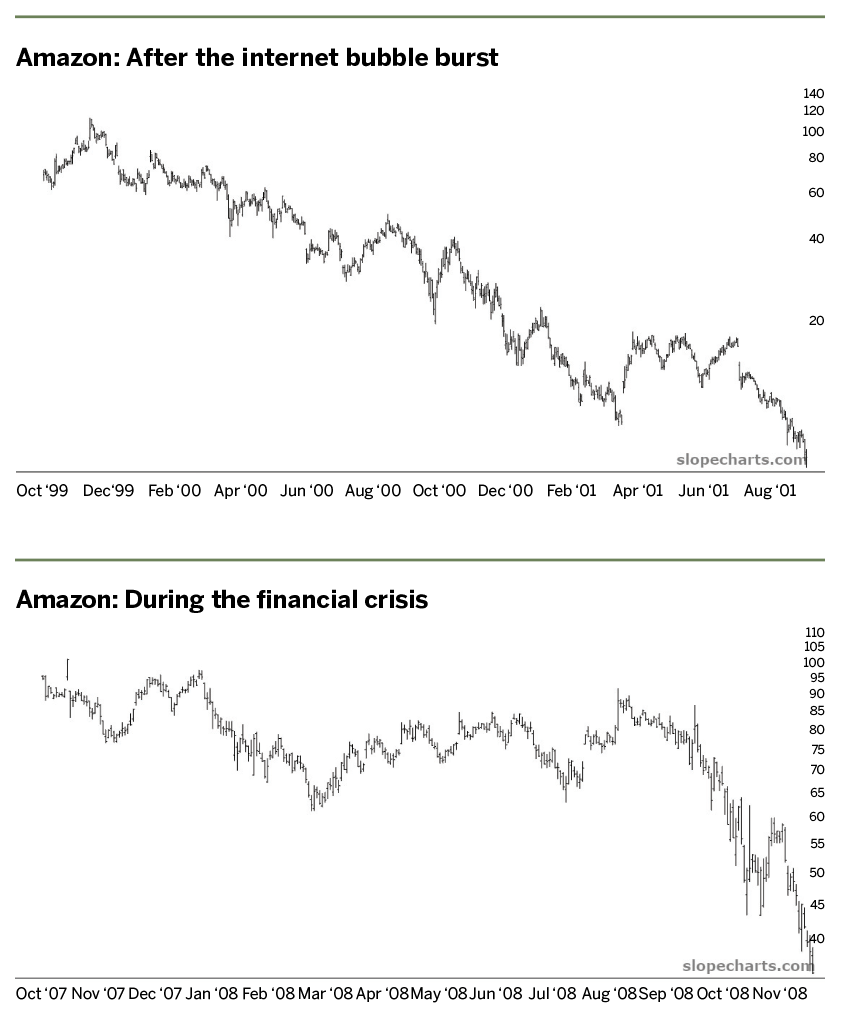
Naturally, the most brutal drop occurred in 2000-2002 when the dot-com bubble burst. Most stocks fell in that period, but web-related stocks were brutalized, with some disappearing altogether. Amazon was a vastly smaller company back then with no guarantee of success, so its price was eviscerated.
200,000%
The rise in Amazon’s stock price since its 1997 IPO
Another smaller but still severe drop took place during the financial crisis of 2008, when Amazon lost “only” about two-thirds of its value. Many people sold their holdings during that tumble, while some clung to their shares steadfastly for a while and finally surrendered when the stock bottomed. Of course, for every seller at the bottom, there is another buyer. But the point is that precious few people held on through the thick and thin of the gyrations.
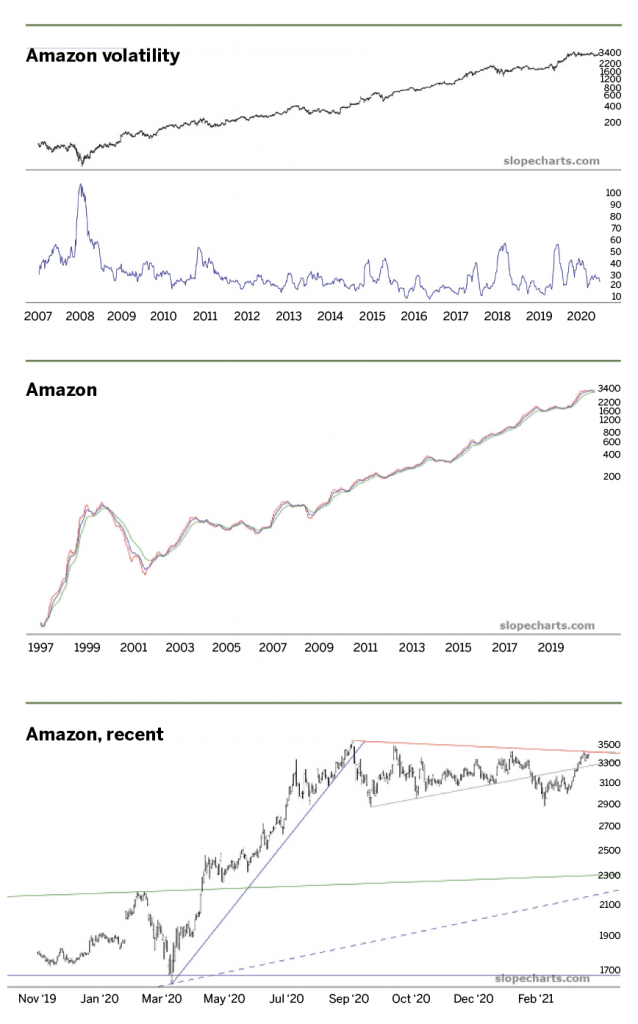
Over the long haul, Amazon has changed from a spunky, risky and relatively small company to one of the largest companies and employers in human history. During that transformation, the volatility of the stock
(as measured by the 30-day implied volatility) has become more and more subdued, such that Amazon seems utterly placid compared to its earlier incarnation.
95.1%
Amazon stock’s eye-watering maximum drawdown
Another way to view this same sea change is by way of a trio of moving averages: the 50-, 100- and 200-day exponential moving averages are shown in Amazon, right, without the price data for the sake of easy viewing. The dynamism and gyrations of these lines have, year-by-year, become much calmer, with only market-wide shocks like the February/March 2020 COVID-19 plunge sending tremors into an otherwise placid ascent to ever-increasing prices.
Monster gains elsewhere
Examining Amazon’s history—its giant ups and its stomach-turning downs—provides some comfort for any who missed the boat (which is about 99.999999% of humanity). Virtually no one who had the foresight and courage to put money into this upstart in May of 1997 would have held on for the duration. It would be interesting to know what percentage of retail buyers in March 1997 still have the stock, but it’s an extremely small number.
The stock’s more recent performance doesn’t match its stellar past. It’s still highly valued and rather expensive based on any traditional fundamental metric. Anyone seeking multi-thousand percent gains had better look elsewhere because the glory days of Amazon are surely behind it. It’s easier for a $10 million company to grow 2,000-fold than it is for a $1 trillion company. There simply aren’t enough people on the planet to buy socks and air fresheners to create that kind of marginal growth.
Perhaps the biggest lesson to learn from Amazon is that the saying about “no such thing as a free lunch” applies to long-term, life-changing investments. It’s easy to look back at the fantastic gains, but to actually enjoy those gains, one has to be practically blind, deaf and dumb to the dreadful fluctuations endemic to a high-growth, high-risk stock. Human nature does not lend itself well to that kind of behavior, but for those blessed with bravado and faith, the rewards have been unfathomably large.
Tim Knight has been using technical analysis to trade the markets for 30 years. He hosts Trading the Close daily on the tastytrade network and offers free access to his charting platform at slopecharts.com.