Essential Investing
Consumer staples may seem boring, but there’s nothing tedious about turning $1 into $5,000

Offering products for every stage of a consumer’s life isn’t always exciting. The five firms studied in this column don’t make virtual reality goggles, gene-editing technologies or space-tourism rockets.
What they make instead is money, both for themselves and for shareholders. Despite being big, boring businesses, they have produced returns substantial enough to establish multi-generational fortunes.
Two of these companies, Coca Cola (KO) and PepsiCo (PEP), have accomplished that lofty goal by peddling sugar water to the world. Two others, Colgate-Palmolive (CL) and Proctor & Gamble (PG), became household names by cranking out cleaning and hygiene products. The fifth, Walmart (WMT), sells groceries and nearly anything else you can think of to the mass market.

Their growth is measured in tens of thousands of percentage points or, in the case of Walmart, over half a million percent—a figure so large you can hardly wrap your mind around it. A single dollar bill invested in Sam Walton’s brainchild in 1977 would have grown to about $5,000 by now.
It’s probably best not to dwell on that particular lost opportunity.
Back on planet Earth, an examination of the charts for these five cradle-to-grave companies reveals many similarities, despite their vastly different businesses. Some have been public much longer than others, so they are normalized to the beginning in 1977, the earliest starting date among them. The percentage comparison above was likewise calculated based on a consistent date of Jan. 3, 1977.
As with all equities, investors can take either a short or a long position, but the mathematical reality is that the maximum gain for a short is 100% whereas the maximum gain for a long is unlimited. Also bear in mind that it violates human nature to hang onto long positions that are growing in value. The sense of relief and the short-term pleasure of taking profits is too alluring.
One way to grasp the eye-popping appreciation of long positions is through an online tool whimsically called Woulda Shoulda Coulda. Users can enter any symbol, any initial investment and any date to learn what its value would be presently, what percentage gain (or loss) was generated and, importantly, what severe drawdowns and losses you would have endured in that span of time.
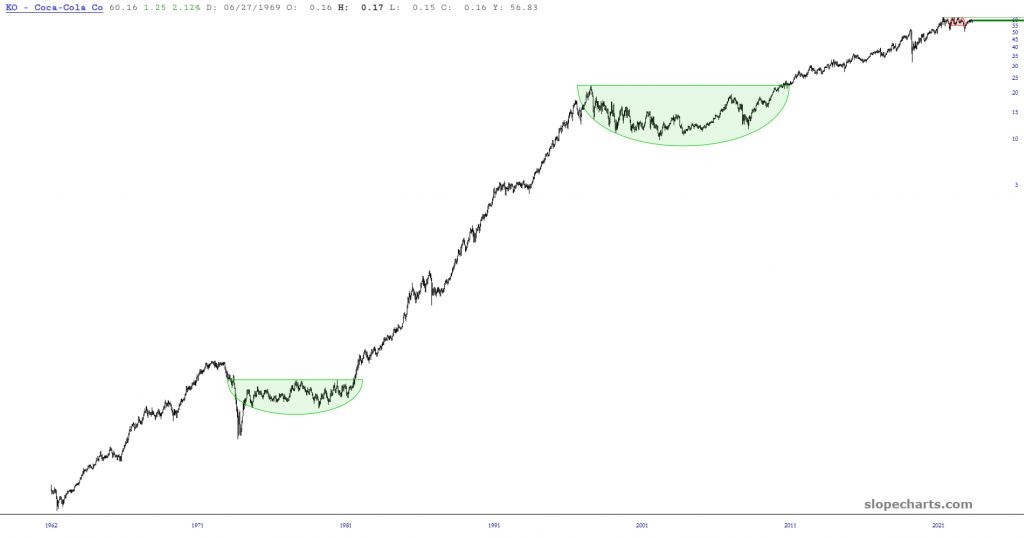
Coca-Cola
Latter-day charts for Coca-Cola, the company that got its start making soft drinks in the 19th century, show phases illustrated by the two saucer bases tinted in green. In each instance, the base was preceded and followed by a lengthy rise, showing how these periods of consolidation—while frustrating for shareholders during those years—merely represented a buildup of energy for another push higher.
Given the huge increases in value in the 1970s and 1980s, all five of these stocks tended to have more muted gains in later years than earlier days.
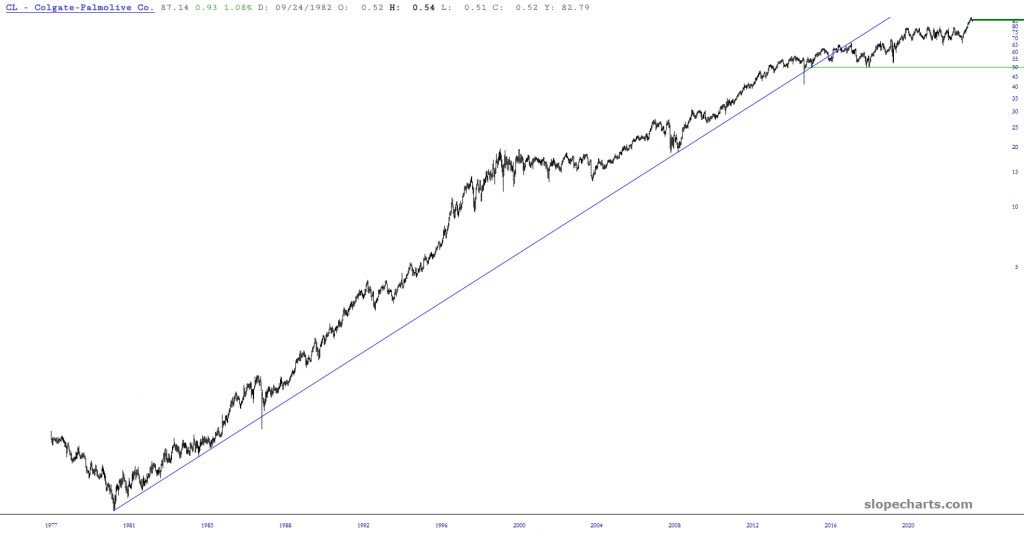
Colgate-Palmolive
This company stayed above an ascending trendline for decades. It slipped below in 2017, making the stock’s ascent more modest in the ensuing years. But it remained a good performer.
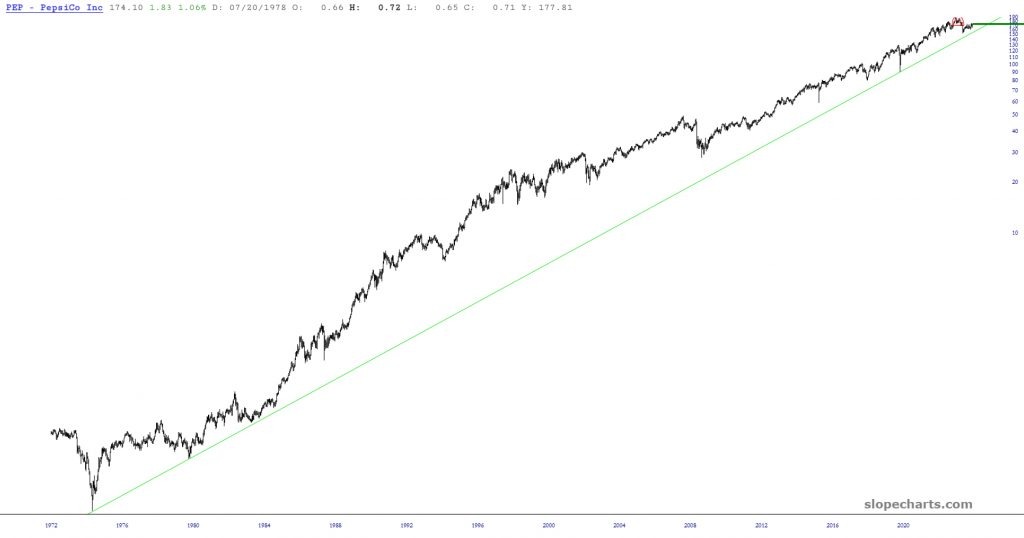
PepsiCo.
Incredibly, PepsiCo hasn’t violated its trendline in half a century. Sometimes the gains were more robust than others (indicated by the growing distance between the prices and the trendline), but this stock has remained a strong performer.
As a side note, all these charts incorporate dividends into the price data, which is a vital part of the overall return for large cap equities such as these.
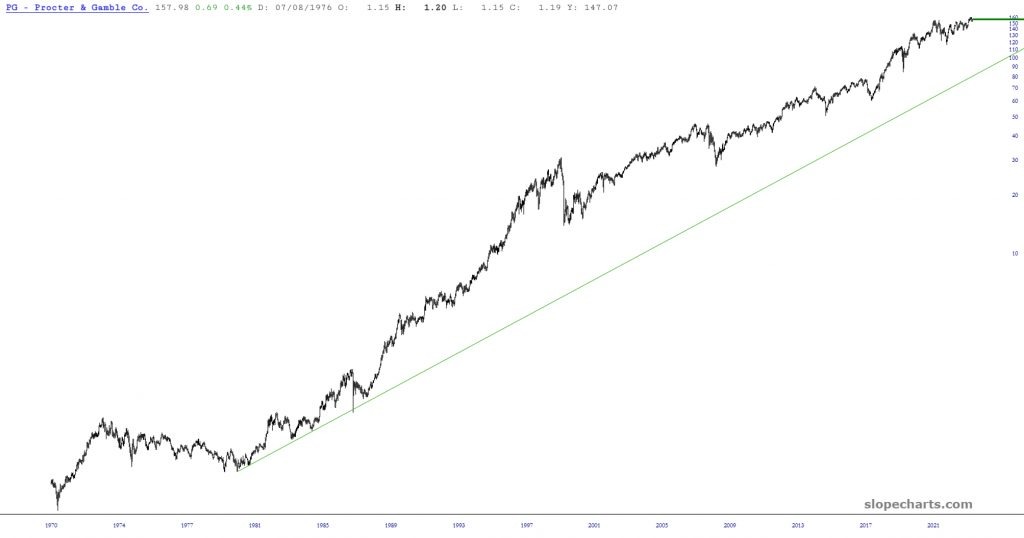
Procter & Gamble
For Procter & Gamble, a trendline anchored to 1980 remains unpunctured.
The 1970s were a poor period for the company because it lost nearly half its value, without even taking inflation into account. On a real-dollar basis, shares were worth far less than half as much as they were a decade earlier. Yet over the next half century the stock swiftly made up for that poor showing.
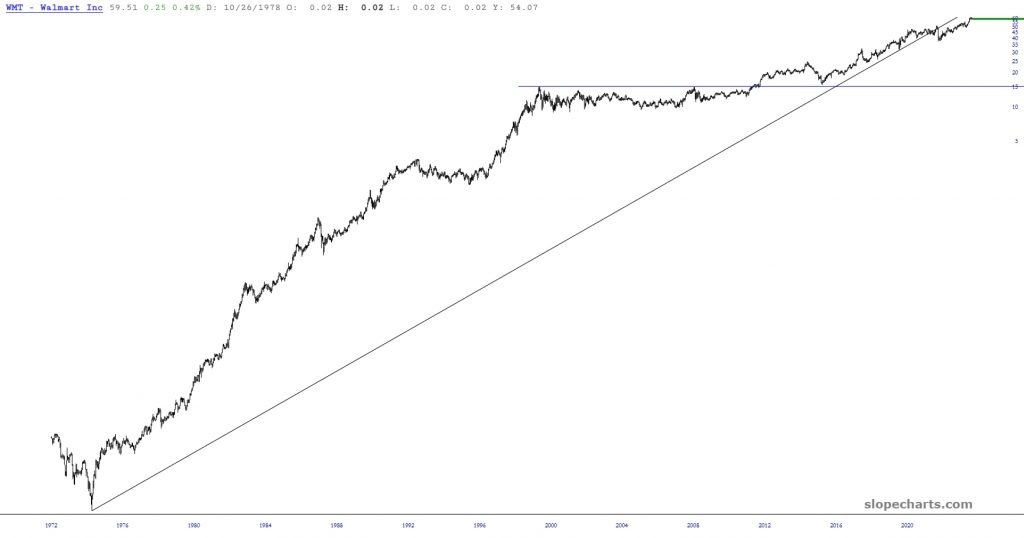
Walmart
Walmart is particularly interesting, not only because it produced by far the largest returns. Even during those incredible gains, it spent a full sixteen years doing absolutely nothing.
Between the end of 1999 and the end of 2015, the net change of the stock was effectively zero. It took sixteen years for the stock to “digest” the hundreds of thousands of percentage points it had appreciated, and then it resumed its growth.
We can draw two broad conclusions from this examination.
First, the most spectacular gains in equities often come from the most mundane enterprises. That makes sense because “everyday” companies sell goods and services to the largest number of consumers.
The other conclusion—which is nearly impossible to apply but should be stated nonetheless—is that truly life-changing gains are most commonly had when one applies the classic trading advice: “Don’t just do something. Sit there!”
Tim Knight has used technical analysis to trade the equity and options markets for decades. He founded Prophet Financial Systems and created the website slopcharts.com, which offers free access to his charting platform. @slopeofhope
For live daily programming, market news and commentary, visit tastylive or the YouTube channels tastylive (for options traders), and tastyliveTrending for stocks, futures, forex & macro.
Trade with a better broker, open a tastytrade account today. tastylive, Inc. and tastytrade, Inc. are separate but affiliated companies.