Disruptive Streamers
Active investors who relish change can find it in these media and entertainment stocks

Where’s the action in the investment world? Look to media and entertainment for market disruption wrought by changing tastes, technological advances and overheated competition.
More specifically, let’s review the fortunes and prospects of three of the sector’s publicly traded companies: Paramount Global (PARA), Netflix (NFLX) and World Wrestling Entertainment (WWE).
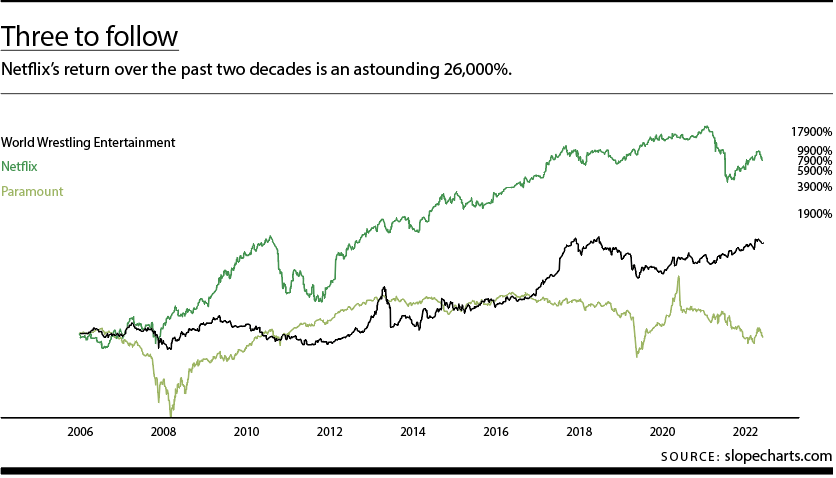
The simplest way to compare the three is with a percentage chart, and we can begin with the year the newest had its initial public offering. As the chart illustrates, Netflix is by far the strongest percentage winner, Paramount is the weakest and WWE resides in the middle.
This type of chart shows, at a glance, which companies have been strong or feeble over the long term but doesn’t necessarily reflect how robust a given security has been recently.
Paramount importance
In a different approach to comparing these three stocks, a ratio chart Back and forth, below, shows each divided by a consistent, independent price history—in this case, the S&P 500 cash index. That normalizes the chart and shows the history of the security. It provides insight into the strength of each stock compared to the market in general.
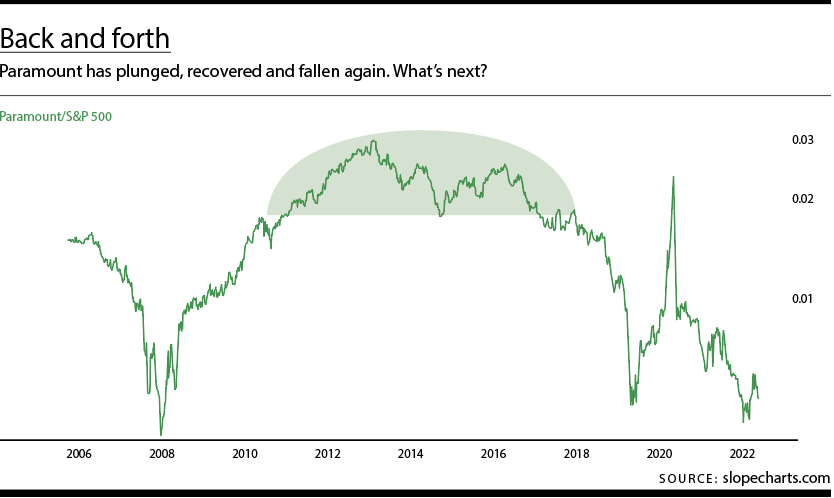
The weakest, Paramount, became public in early 2007. Over the next 16 years, it produced a return of approximately 0%, which is stunningly bad in a generally strong market.
The stock plunged even harder than the market in general in 2007 and 2008, recovered strongly into 2013 and has been weak ever since.
Even though this is a ratio chart, patterns like the rounded top still apply. A sharp, transitory spike during the COVID-19 crisis—probably because of the popularity of streaming during lockdowns—has dissipated, returning the stock to its severely underperforming ways.
Neo-blockbuster
Netflix, one of the most successful stocks of the 21st century, became public in the middle of 2002 and has thrown off a return of 26,000%, even after a devastating drop in 2023.
Yet, despite that amazing performance, the stock has actually formed a terrifically bearish pattern over the past half-decade as viewed through the lens of the ratio chart below.
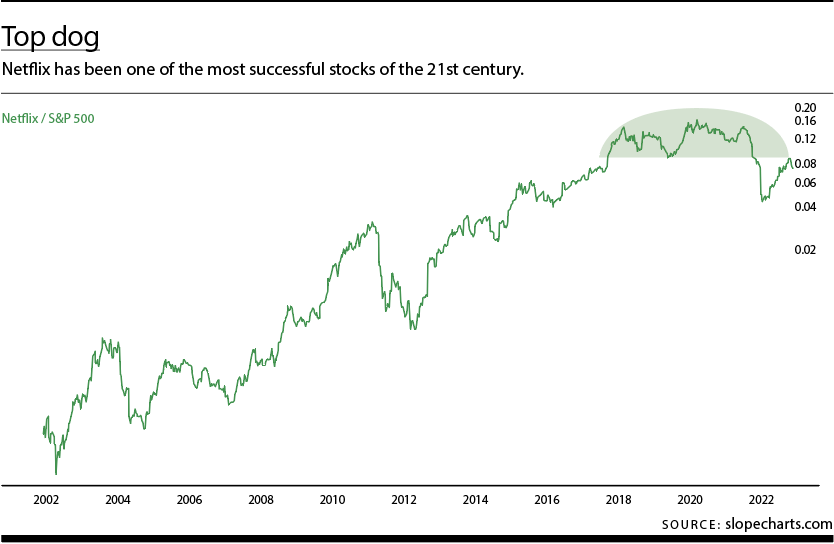
It’s not visible in a raw price chart, but the graph shown here displays a massive topping pattern, a hard fall and then a return to resistance. It would seem Netflix is terrifically vulnerable.
Full body slam
World Wrestling Entertainment hasn’t performed nearly as strongly as Netflix over the years but has exhibited outsized strength in its ratio chart, as seen below. The chart’s green areas indicate spikes in power.
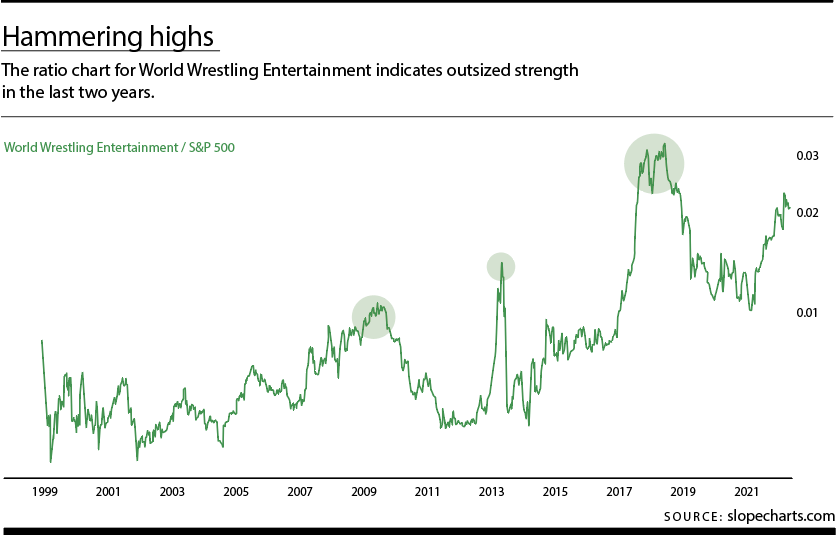
Compared to the market in general, the stock seems to be hammering out a steady series of higher lows and higher highs—the most fundamental definition of an uptrend.
The 650% return on the stock pales in comparison to 26,000%, but World Wrestling Entertainment has performed robustly as of late, and its uptrend may remain intact over the long haul.
Medium changes
Don’t take anything for granted in the world of entertainment. In the 1990s, the Blockbuster chain of video rental stores famously ignored the threat of a company called Netflix that sealed DVDs in little red envelopes and mailed them to subscribers. By the time Blockbuster took its new competitor seriously, it was too late.
But disruption doesn’t always require a better business model. Pure chance can make the difference. As mentioned earlier, COVID-19 gave Paramount a boost that turned out to be ephemeral, and the stock price soon reflected that.
The takeaway is investors should look at more than just a stock’s raw price or even its comparative performance. Instead, they can view securities through an additional lens, which in this case was relative performance versus a broad index. That way, they can tease out a stock’s unvarnished behavior compared to its peers.
Tim Knight has used technical analysis to trade the equity and options markets for decades. He founded Prophet Financial Systems and created the website slopecharts.com, which offers free access to his charting platform. @slopeofhope