4 Market Sectors to Watch
Lower interest rates could boost some corners of the market, including commercial real estate

- The Federal Reserve’s next major policy meeting is scheduled for July 30-31.
- The U.S. central bank is expected to keep interest rates unchanged at that meeting, with a cut anticipated in mid-September.
- When the Fed eventually pivots and cuts rates, key market sectors like real estate, utilities, consumer discretionary and information technology could get a boost.
The interest rate futures market expects the Federal Reserve to keep interest rates unchanged when it meets next week. That means the key benchmark for U.S. interest rate—the Federal funds rate—will remain between 5.25% and 5.50% at least until mid-September, when the Fed’s subsequent policy meeting is scheduled.
However, expectations are building that the Fed will finally pivot during the September meeting, opting to cut rates for the first time since March 2020. The initial reduction is expected to be a quarter percentage point, lowering the target range for the Federal funds rate to 5.00% or 5.25%.
Yet, if the economy takes a sharp downturn in the interim, tha could easily translate to a half percentage point cut, bringing benchmark rates down to a range of 4.75% to 5.00%. That would be significant because it would immediately reduce borrowing costs for consumers and businesses, potentially freeing up capital to use elsewhere.
Depending upon market sentiment at that time, this anticipated move by the Fed could provide some support to valuations in the stock market. However, certain sectors could experience a more immediate and pronounced impact from the reduction in rates, such as real estate, consumer discretionary, utilities and information technology.

Market sectors that could benefit from lower rates
Real Estate
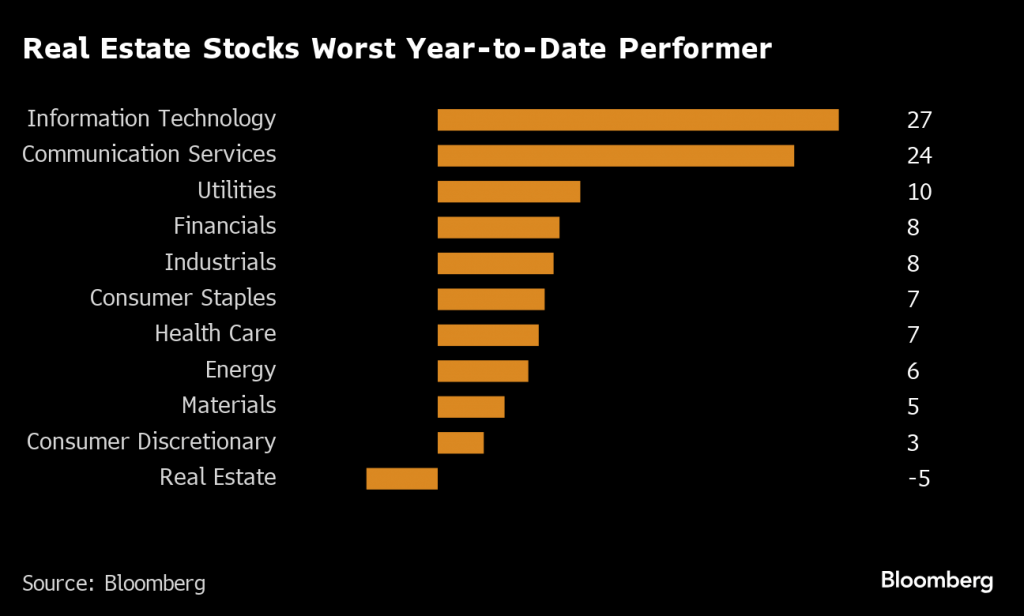
During the first six months of 2024, the real estate sector was one of few major investment categories posting a decline. Over that period, the real estate Select Sector SPDR Fund (XLRE) was down 5.7%, as illustrated below.
Considering this market context, the real estate sector could become a significant beneficiary of declining interest rates. Most real estate transactions are financed through borrowing, meaning lower rates can stimulate increased activity and investment in this sector.
As interest rates drop, borrowing costs decrease, making it more affordable for individuals and businesses to finance property acquisitions. This boost in affordability can lead to a surge in residential mortgages and commercial property deals.
For real estate companies, lower interest rates enhance profitability. Reduced financing costs mean these companies can allocate more resources to operations and development or directly improve their bottom lines. This financial flexibility can spur growth and innovation, enabling companies to take on new projects and expand their portfolios.
The commercial real estate market, particularly office properties, has faced significant challenges since the onset of the COVID-19 pandemic. The shift to remote work and hybrid work models has decreased demand for office space, leading to increased vacancies and declining property values. While lower interest rates won’t directly address the reduced demand for office space, they can make financing these properties more attractive.
This potential drop in financing costs could catalyze a new wave of office space conversions. Real estate companies might seize the opportunity to repurpose underused office buildings into residential housing or mixed-use developments. Such conversions could help alleviate the housing shortage in many urban areas while revitalizing struggling commercial real estate assets.
Moreover, the residential real estate market could see a significant uptick as well. Lower mortgage rates can make homeownership more accessible, potentially driving up home sales activity. This, in turn, can benefit homebuilders and real estate developers, who may experience increased demand for new housing projects.
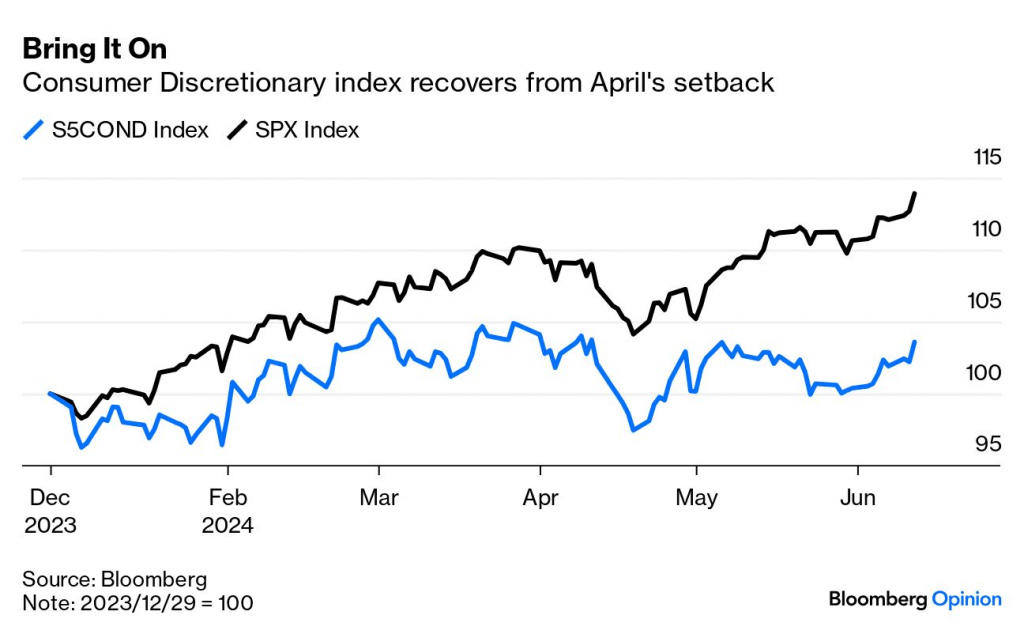
Consumer discretionary
The consumer discretionary sector—companies that produce non-essential but desirable goods and services—stands to benefit significantly from a reduction in interest rates. This diverse sector includes industries such as automotive, household durables, leisure equipment, textiles and apparel, as well as services like hotels, restaurants and entertainment.
Consumer discretionary companies thrive when consumers have ample disposable income. During periods of economic growth, consumers tend to feel more confident and are more inclined to spend on luxury and non-essential goods and services. However, when budgets are tighter in tougher economic times, this discretionary spending tends to decline. This sector is inherently sensitive to the economic climate, reflecting consumer confidence and spending power.
High interest rates further complicate this landscape. Elevated financing costs discourage consumers from using credit to make non-essential purchases, dampening demand for discretionary goods and services. As a result, a reduction in interest rates can act as a catalyst for increased consumer spending in this sector.
However, the positive impact of lower rates is contingent upon the overall health of the economy. If the economy remains strong, a rate cut could bolster consumer spending and drive growth in the consumer discretionary sector. On the other hand, if economic conditions worsen, even lower interest rates may not be enough to spur the necessary consumer confidence and spending.
In essence, the consumer discretionary sector could see a notable uplift from a decline in interest rates, provided the broader economic environment remains stable. Investors looking to capitalize on this potential should keep a close eye on economic indicators and consumer sentiment because they will be key determinants of the sector’s performance in a lower-rate environment.
Utilities
The utilities sector stands to gain from a reduction in interest rates. Utility companies are often required to invest in large-scale projects, such as power plants, grid expansions and renewable energy initiatives—all of which demand substantial capital outlays. To finance these ventures, utilities frequently rely on debt.
A cut in interest rates would be immensely beneficial for utilities because it would reduce the cost of borrowing for both new projects and existing debt. Lower financing costs can enhance their profitability and enable them to improve their bottom lines or allocate more resources to development and maintenance.
Another critical aspect of the utilities sector is its dividend yields. Utilities are known for offering stable and attractive dividends, making them a favorite among conservative investors seeking steady income. However, when interest rates rise, these investors often shift their focus from utilities to bonds, which offer higher yields and greater safety when interest rates are high. Consequently, higher rates can make utilities stocks less appealing.
As benchmark rates decline, demand for utilities stocks should increase. Lower interest rates can make the dividend yields of utilities more attractive relative to other income-generating investments, drawing investors back to this sector. The increased demand can drive up the stock prices of utilities companies, further benefiting investors.
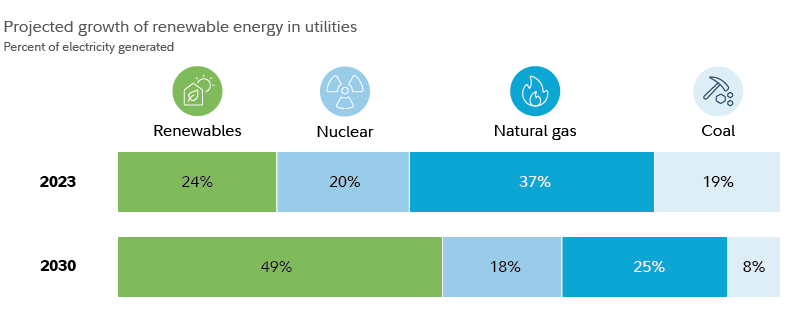
On top of all this, another key narrative is unfolding in the utilities sector: the growing demand from artificial intelligence.
Data centers, which are crucial for AI operations, require significant energy consumption. And as the AI sector expands, the demand for electricity provided by utilities is expected to increase. This trend presents an additional growth opportunity for utilities companies, positioning them as key players in the technological revolution.
For more background on this narrative, readers can read this previous post: AI Boom Electrifies the Utilities Sector.
Information technology
The technology sector has been on a rollercoaster ride over the past two years. When the Federal Reserve began raising interest rates in 2022, tech stocks took a nosedive, reflecting the sector’s sensitivity to higher borrowing costs. However, since the start of 2023, tech stocks have staged a dramatic comeback, particularly among the titans of the industry.
This resurgence, though impressive, belies a more complex landscape. While major players like Apple (AAPL), Microsoft (MSFT),and Alphabet (GOOGL) have thrived, smaller and mid-sized tech companies continue to grapple with the fallout from elevated interest rates. The collapse of Silicon Valley Bank in the spring of 2023 underscored this struggle, highlighting the precarious position of many smaller firms that rely heavily on credit.
For these burgeoning tech companies, access to affordable capital is not just a convenience—it’s a necessity. These firms are often in their growth phases, requiring significant investment in research, development, and market expansion. High interest rates have made borrowing more expensive, squeezing their margins and hampering their growth.
A cut in the Federal funds rate would provide a much-needed reprieve. Lower borrowing costs could ease the financial strain on these smaller and mid-sized companies, enabling them to invest more in innovation and expansion. This, in turn, could bolster their competitive standing and improve their bottom lines.
But the benefits of a rate cut wouldn’t be confined to the small and mid-cap segment. Large-cap tech companies, despite their recent successes, also stand to gain. Lower rates could enhance their already robust financial positions, enabling them to invest further in cutting-edge technologies like artificial intelligence and machine learning. In essence, while smaller companies might experience the most immediate relief, the entire sector stands to benefit from a more accommodative monetary policy.
Andrew Prochnow has more than 15 years of experience trading the global financial markets, including 10 years as a professional options trader. Andrew is a frequent contributor of Luckbox Magazine.
For live daily programming, market news and commentary, visit tastylive or the YouTube channels tastylive (for options traders), and tastyliveTrending for stocks, futures, forex & macro.
Trade with a better broker, open a tastytrade account today. tastylive, Inc. and tastytrade, Inc. are separate but affiliated companies.