AMZN: Prime Sell
Candlestick chart analysis for intermediate-term trading
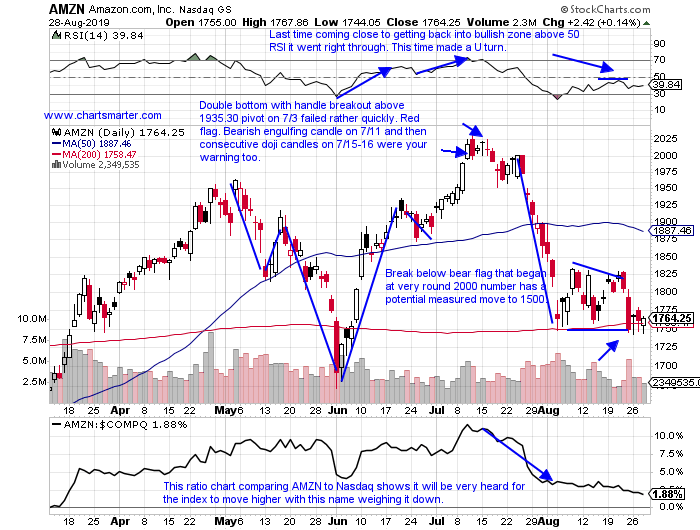
As the third-largest Nasdaq and S&P 500 component, Amazon (AMZN) has a significantly large influence over market direction. At 22%, it is the top holding in The Consumer Discretionary Select Sector SPDR Fund (XLY)—nearly double that of Home Depot (HD), the second largest name.
Amazon charted a bullish Harami candle late last month. The Harami is a Japanese candlestick pattern that indicates either a potential reversal, or, a continuation in the market.
A break below the bear flag that began around
the 2,000 mark suggests a potential measured move to 1,500. The 50-day simple moving average is beginning to slope lower. The flag carries extra weight with the possible implications of a break below its 200-day simple moving average.
Douglas Busch, CMT, trades U.S. equities using technical analysis with an emphasis on Japanese candlesticks. @chartsmarter