TTWO: Take-TwoTransactions
Candlestick chart analysis for intermediate-term trading
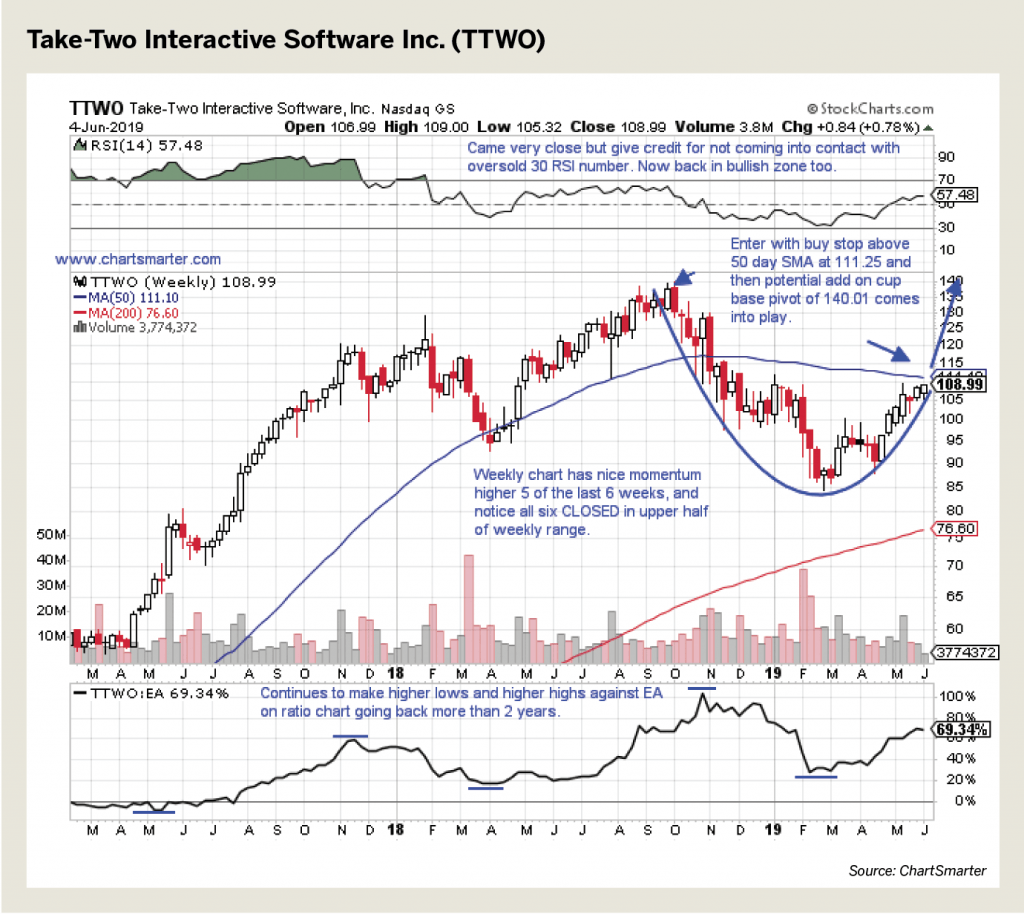
Take a look at this daily chart of Take-Two Interactive Software Inc. (TTWO). It’s evident that price is about to break above the 200-day simple moving average. Price lost ground only five sessions in all of May and is showing great relative strength versus its peers, which have been down 22% from the most recent 52-week highs.
Activision Blizzard (ATVI) and Electronic Arts (EA) are lower by 49% and 38% from their respective highs. Take-Two continues to make higher lows and higher highs against Entertainment Arts on a ratio chart going back more than two years.
Enter this trade opportunity with a buy stop above the 50-day simple moving average at $111.25. Watch for a potential add-on cup base pivot if it hits $140.01.
Douglas Busch, CMT, trades U.S. equities using technical analysis with an emphasis on Japanese candlesticks. @chartsmarter