Boom or Bust—What’s Next for Retailing?
Over the years, some retailing-sector equities have posted staggering gains
Circumstances—like inflation or the fickle tastes of consumers—can whip valuations of retailers up or down by thousands of percentage points over the long haul.
The wildest high-stakes sectors, such as biotechnology, can move more dramatically than retailing, but staid industries, such as equipment manufacturing or banking, are no match for the movement in store-related stocks.
So, let’s look at some high-end, publicly traded retailers and some of the manufacturers that supply them. Fifteen companies with histories of at least a decade in the markets come to mind:
Big Five Sporting Goods (BGFV), Dick’s Sporting Goods (DKS), Birks Group (BGI), Charles & Colvard (CTHR), Fossil Group (FOSL), Hibbett (HIBB), Haverty Furniture (HVT), Interparfums (IPAR), Kirkland’s (KIRK), Movado Group (MOV), PVH Corp. (PVH), Restoration Hardware (RH), Signet Jewelers (SIG) and Tapestry (TPR).
In recent years, most of these stocks have increased in value, and a few have posted absolutely eye-popping returns. Let’s judge them on their performance over the last 10 years.
Standouts and laggards
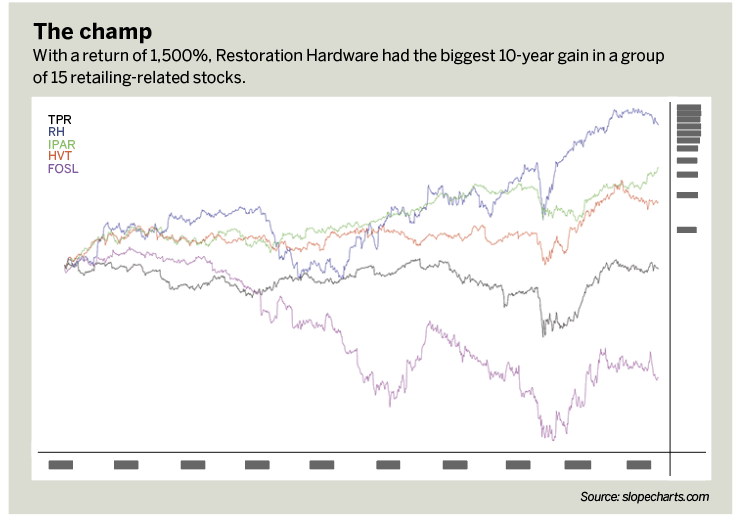
The biggest winner, Restoration Hardware, returned about 1,500%. But it hasn’t achieved a steady ascent, and bad timing has caused plenty of investors to lose money on the stock.
Yet, over the long haul of a decade, particularly in the past few years, the stock enjoyed an absolutely scintillating run. (See “The champ,” below.)
With a return of almost 700%, Interparfums takes the second-place spot. This fragrance maker has been pushing to lifetime highs recently, and its ascent has been steadier than Restoration Hardware’s climb.
The COVID-19 bear market in April 2020 took its toll on the perfume manufacturer, but those losses were swept aside quickly and the stock had an amazing run through the end of 2021.
Setting aside the decade-long time stricture, Interparfums reigns as the biggest overall winner with a breathtaking return of about 13,000% over its life as a publicly traded entity.
Havertys, a furniture retailer, gained about half as much as Interparfums in the last 10 years, but a 370% return is still quite good.
One cautionary note on this stock: Almost all of the gains for Havertys occurred in the span of just a few months. It happened just once and then the stock languished for years.
Some of the group’s stocks require even more caution. Sally Beauty has declined by about 10% over the 10-year period, and so has Tapestry, purveyor of the Coach, Kate Spade and Stuart Weitzman brands.
Last place among the stocks tracked here belongs to Fossil Group, Inc., a watch manufacturer that lost about 90 percent of its market cap and has spent most of the past decade as one of very few stocks consistently working its way lower, year after year.
Correlating all 15
Using the same 10-year time period, a correlation analysis was performed against the 15 ticker symbols in the original set. (See “Matchup,” below.)
In the correlation grid, the bright green diagonal simply shows the perfect “1.0” correlation of each ticker to itself, which is obvious and uninteresting.
The other colors are easier to interpret: Greener indicates a more positive correlation, and redder means a more negative correlation.
Relative performance
Because Interparfums has remained especially strong over its entire history, let’s compare its performance with XRT, an exchange-traded fund for retailing. XRT began trading in 2006, so the comparison is confined to that timespan. (See “Overachiever,” below.)
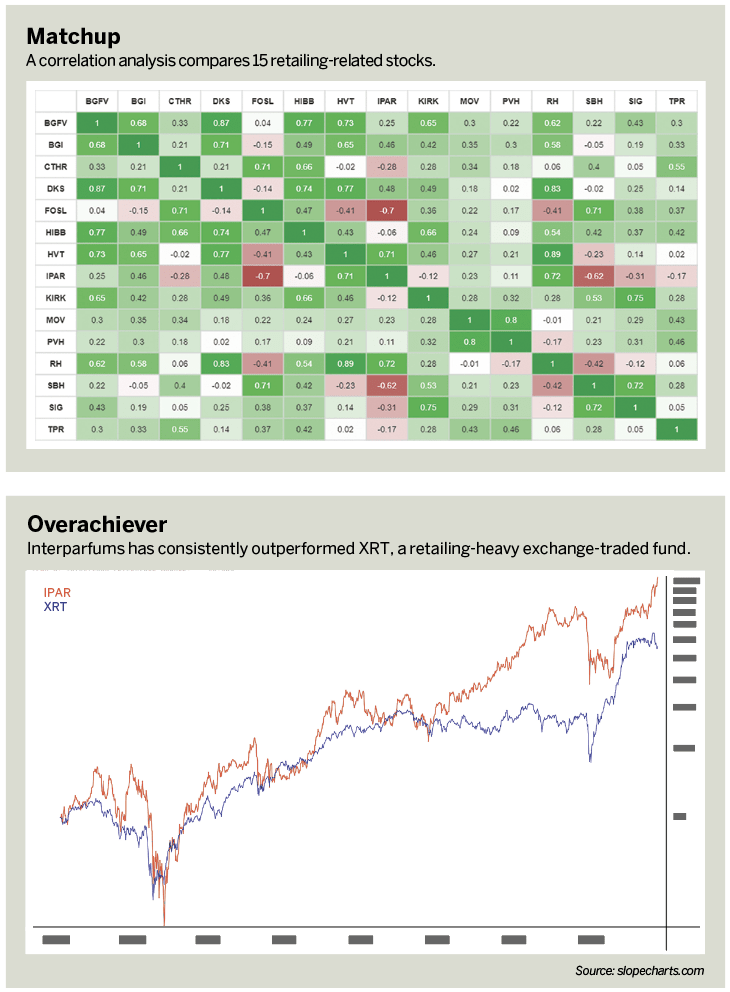
As shown in the graphic, Interparfums tracked XRT and consistently outperformed XRT in general. That indicates Interparfums’s powerful performance wasn’t a fluke or outlier.
Its outsized performance has been consistent over the years, compared end-to-end with retail stocks in general.
As one last analysis, the broad retailing fund is reflected in a ratio chart, with XRT as the numerator and SPDR S&P 500 ETF Trust (SPY) as the denominator. SPY has traded much longer than XRT, so the ratio chart commences in 2006, when XRT began. (See “Beating the market?” below.)
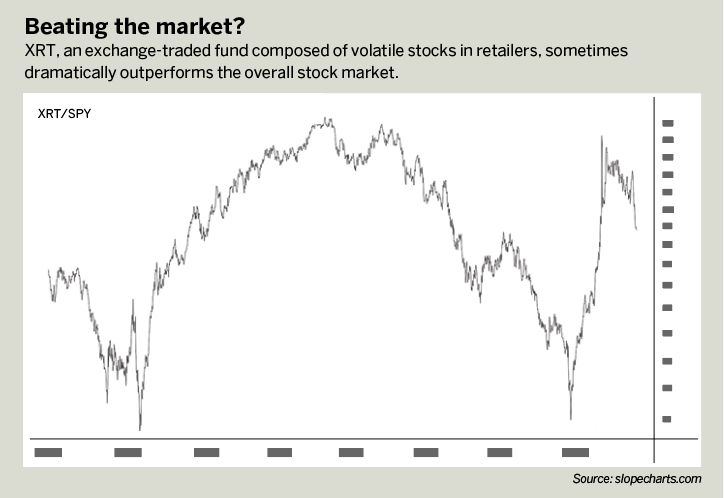
This ratio chart clearly shows the high volatility of the retail sector. It’s the proverbial “feast or famine,” either dramatically outperforming the overall stock market (2009 through 2013, inclusive) or severely underperforming (2014 to early 2020).
The nadir came in the spring of 2020 when the COVID-19 lockdown battered the retail sector.
There’s ample room for more “softening” to the downside before retail stocks represent a true bargain again. When they do reach that point, it will pay to focus on companies that have performed well over the long haul.
Tim Knight has been using technical analysis to trade the markets for 30 years. He’s the host of Trading the Close on the tastytrade network and offers free access to his charting platform at slopecharts.com. @slopeofhope