Lessons From the Last Crisis: Volatility and the VIX
Since its introduction in 1993, the VIX has only closed above 80 during two periods in U.S. market history: the 2008-2009 Financial Crisis and now during the 2020 “Coronacrisis.”
The three instances in which the VIX closed the trading day above 80 include:
- March 16, 2020: 82.69
- Nov. 20, 2008: 80.86
- Oct. 27, 2008: 80.06
The above means that in terms of market volatility, the current environment qualifies as one of the most extreme in (recent) record.
That probably isn’t news to most investors and traders who have been watching stock market indexes swing between 5-10% seemingly daily since the spread of the coronavirus intensified on U.S. soil.
As one can see in the bullet points below, large swings in the market indexes have indeed corresponded with both the Financial Crisis and the Coronacrisis. Of the top 10 single-day largest magnitude (percentage) moves in the history of the Dow Jones Industrial Average (up and down), seven of those 20 instances were observed in either 2008 or 2020:
- March 16, 2020: -12.93%
- March 24, 2020: +11.37%
- October 13, 2008: +11.08%
- October 28, 2008: +10.88%
- March 12, 2020: -9.99%
- March 13, 2020: +9.36%
- October 15, 2008: -7.87%
Per the above bullet points, equity markets can make big swings in either direction during a “crisis.” As a result, crisis situations are somewhat different than “normal” trading conditions, because the VIX can actually increase on “up” days in equity markets.
This was observed on March 24, when the VIX moved several points higher from open to close, despite the fact that equity prices were rallying.
This is somewhat contrary to “normal” market conditions because the VIX often declines as broad market indexes drive higher—represented by a strong historical inverse correlation that exists between stock indexes such as the S&P 500 and the VIX.
But when equity markets are distressed, huge gains, like the ones observed on the 24th, actually confirm that extreme levels in the VIX are justified.
The persistence of elevated volatility, despite the strong rally in equities this past week, is illustrated in the slide below:
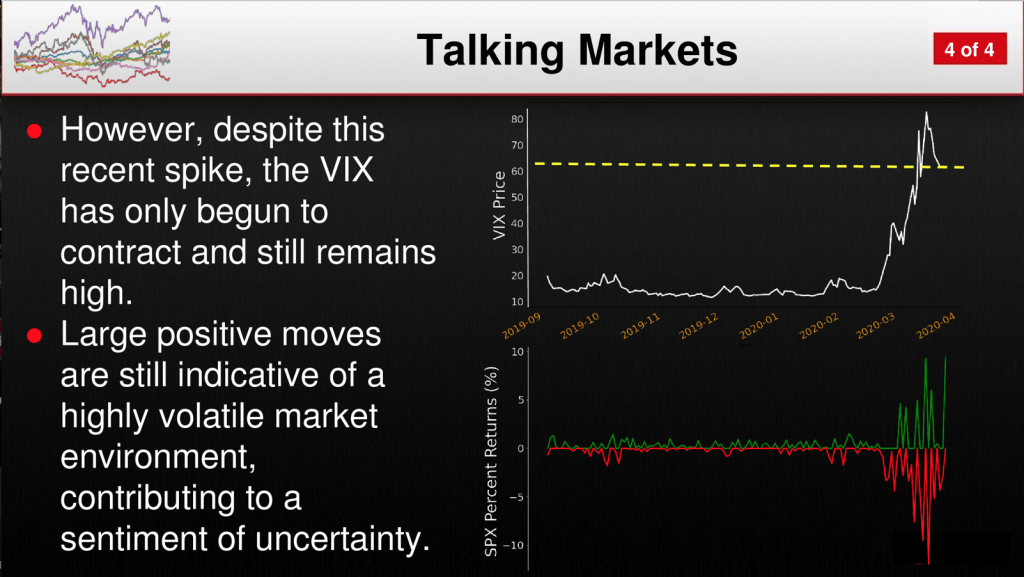
So if strong rallies aren’t effective at reducing overall volatility, then one might naturally wonder what would push the VIX lower?
The answer to lower volatility is just that: lower volatility.
Primarily, this presents itself in the form of smaller absolute magnitude moves in the market indexes. For example, if the Dow were to start recording intraday moves of 1-2%, instead of 5-10%, that would represent a lower level of actual volatility. And when smaller magnitude moves are realized, it becomes a whole lot harder to justify extreme nosebleed levels in the VIX.
Aside from keeping on the lookout for smaller moves in the indexes, traders can also follow the VVIX, which is often referred to as “the VIX of VIX.” The VVIX is said to measure the “vol of vol” because it reports on the implied volatility of the VIX itself.
The VVIX has only climbed above 200 a few times in its history, and one of those was earlier this month. Whenever smaller magnitude moves are finally realized in the major market indexes, one would expect to observe a drop in VVIX as well.
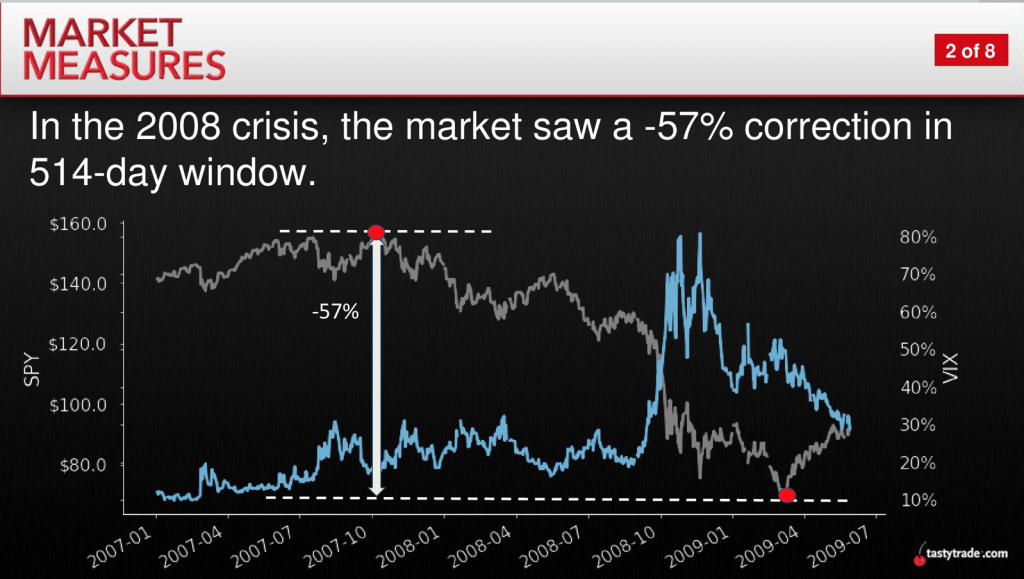
In terms of learnings from the 2008-2009 Financial Crisis, traders may also want to keep in mind that the S&P 500 didn’t bottom until three months after the VIX peaked.
The peak in the VIX during the Financial Crisis occurred on Nov. 20, 2008, while the bottom in the S&P 500 wasn’t observed until March 6, 2009, as illustrated below:
For more context on how the current volatility environment compares to the 2008-2009 Financial Crisis, readers are encouraged to review a two-part series on the tastytrade financial network when scheduling allows:
Sage Anderson is a pseudonym. The contributor has an extensive background in trading equity derivatives and managing volatility-based portfolios as a former prop trading firm employee. The contributor is not an employee of Luckbox, tastytrade or any affiliated companies. Readers can direct questions about topics covered in this blog post, or any other trading-related subject, to support@luckboxmagazine.com.