Tracking and Trading the Latest Surge in VIX
The CBOE Volatility Index (VIX) closed above 30 on Dec. 1 for the first time since February, but based on recent history, that may be a bullish signal for the financial markets.

On Dec. 1, the CBOE Volatility Index (VIX) closed above 30 for the first time since Feb. 1, and despite a strong rally in markets on Dec. 2, the infamous “fear gauge” still managed to close trading above 30 for the week.
Notably, this period represents the first strong bout of volatility observed in the financial markets since February.
So, what’s got the markets on edge?
The emergence of the new omicron variant of COVID-19 has certainly contributed to unease. But the recent adoption of a hawkish stance by the U.S. Federal Reserve is also undoubtedly playing a big role in the recent spike in volatility.
When central bankers cut interest rates—as seen during the onset of the coronavirus crisis—investors and traders usually flock to the stock market in search of higher returns. And that was exactly what was observed in 2020 after the U.S. Federal Reserve cut interest rates to zero.
So, with the Fed now poised to step back its assistance to the economy, it’s not necessarily a surprise to see the markets on edge.
Interestingly, the current reading in VIX—around 30—has also been a fairly effective predictor of positive returns in the market during 2021, a trend that’s illustrated in the chart below, showing how market volatility trended lower once the VIX reached the 29-30 mark.
It’s important to note that past performance is never a guarantee of future returns—meaning the VIX could keep climbing from here (instead of reverting), and that the major market indexes could continue to slide.
What about VVIX?
During tumultuous periods in the financial markets, it can also help to refer to the CBOE VIX Volatility Index (VVIX), which shouldn’t be confused with the regular VIX.
As most are aware, the VIX is calculated using the implied volatility of options in the S&P 500. As implied volatility rises in S&P 500 options, so too does the VIX.
Alternatively, the VVIX is calculated using the implied volatility of out-of-the-money put options in the VIX itself. That’s why the VVIX is often said to measure the “volatility of volatility,” or “vol of vol.”
Practically speaking, the VIX gauges risk premium in S&P 500 options, whereas the VVIX gauges the risk premium in VIX options. Consequently, VVIX provides further insight to market participants on the current risk dynamic.
For context, the long-term average in the VIX is around 19, while the long-term average in the VVIX is about 90. VVIX is currently trading about 156, which is well above the long-term average.
What About the VVIX/VIX Ratio?
Investors and traders often use the ever-changing relationship between VVIX and VIX to monitor the market’s prevailing risk dynamic—through a metric known as the “VVIX/VIX ratio.”
Historically, the VVIX/VIX ratio tends to be lower during periods of extreme volatility and higher during periods of relative complacency.
For example, during that extremely volatile day on March 16, 2020, the VVIX over VIX ratio closed the trading day at about 2.5 (207/82 = 2.5).
In comparison, on Oct. 5, 2017, the VIX posted one of its lowest closing prices of all time at 9.19—a clear indication of market complacency. On that same day the VVIX closed trading just over 91—meaning that the VVIX/VIX ratio at the close of trading on Oct. 5, 2017 was about 10.
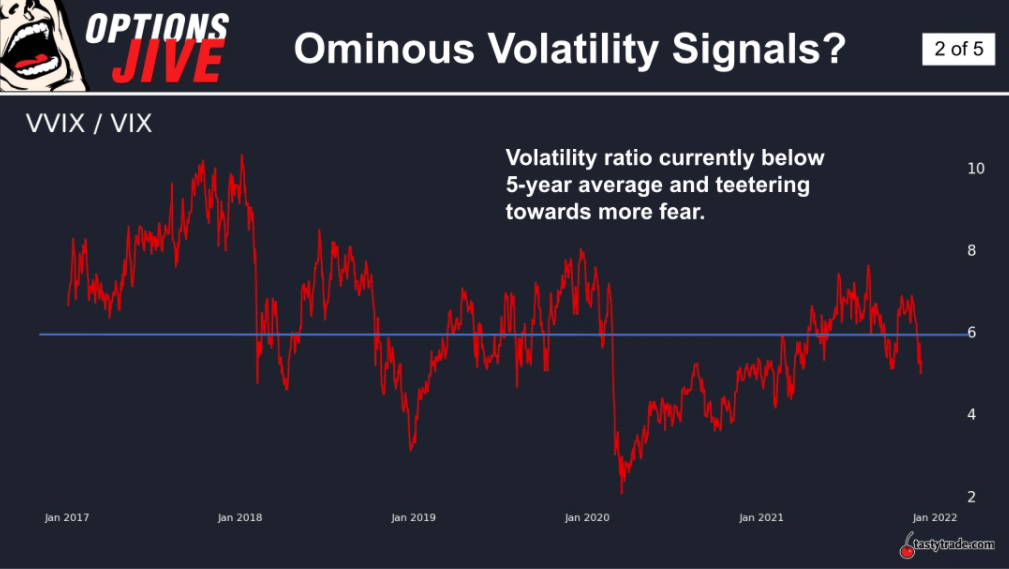
In recent years, that means the VVIX/VIX ratio has ranged between roughly 2.5 (when market volatility was peaking) and almost 10 (when market volatility was historically complacent).
The chart below illustrates how the VVIX/VIX ratio has been diving toward the lower end of its historical range in recent weeks, reinforcing the notion that the risk dynamic in the market has shifted.

As of today, the VVIX/VIX ratio stands at around 5.2 (156/30 = 5.2), and as shown above has declined significantly from the more “complacent” levels observed earlier this year.
Readers seeking to learn more about the current volatility environment are encouraged to review a new episode of Options Jive on the tastytrade financial network.
For timely updates on everything moving the financial markets, readers can also tune into TASTYTRADE LIVE—weekdays from 7 a.m. to 4 p.m. Central Time at their convenience.
Get Luckbox! Subscribe to receive 10-issues of Luckbox in print! See SUBSCRIBE or UPGRADE TO PRINT (upper right) for more info or visit getluckbox.com.
Sage Anderson is a pseudonym. He’s an experienced trader of equity derivatives and has managed volatility-based portfolios as a former prop trading firm employee. He’s not an employee of Luckbox, tastytrade or any affiliated companies. Readers can direct questions about this blog or other trading-related subjects, to support@luckboxmagazine.com.


