Pro Tip: Trading Short Options During Market Corrections
During choppy periods in the financial markets, risk premiums tend to increase, making options/volatility sales relatively more attractive.

After many months of outperformance, the stock market finally hit a speed bump, and has faltered out of the gate in 2022.
As of Jan. 23, the S&P 500 is down about 8% year-to-date, while the Nasdaq 100 has officially entered “correction” territory, and is down nearly 12% since the start of the year.
For stock indices, a market correction is typically defined as a pullback of at least 10%, whereas corrections of 20% or more are typically categorized as so-called “bear markets.”
Only time will tell if the current pullback will transform into the latter variety, as seen during the onset of the COVID-19 pandemic in early 2020.
According to data previously compiled by tastytrade, the U.S. stock market experienced 200 corrections of at least 5% between the years 1995 and 2011. Moreover, that same period saw 48 corrections of at least 10%.
This data indicates that minor corrections in the stock market are fairly common, and possibly even “healthy”—as market pundits often describe them.
On the other hand, serious market corrections of at least 20% (often referred to as bear markets) are much less infrequent. Going back to 1946, there have been only 12 major stock market corrections in U.S. history, including the one from 2020.
The 12 major market corrections of more than 20% in U.S. stock market history are listed below (month/year of market bottom and percent decline).
- May 1946 (-21%)
- June 1948 (-20%)
- October 1957 (-21%)
- June 1962 (-28%)
- October 1966 (-22%)
- May 1970 (-36%)
- October 1974 (-48%)
- August 1982 (-27%)
- December 1987 (-33%)
- October 2002 (-49%)
- March 2009 (-57%)
- March 2020 (-34%)
Major corrections don’t usually occur in quick succession of one another. But of course, that doesn’t mean a significant market correction (i.e. bear market correction) can be ruled out in the foreseeable future.
However, if a bear market correction does materialize, many investors and traders would likely view that development as an incredible opportunity to buy stocks at a discount, much like what was observed in March of 2020. That said, there’s no guarantee that prices would snap back as quickly as they did in 2020.
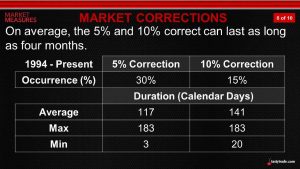
For example, when the stock market corrected in 2008-2009 amidst the Great Recession, it took a lot longer for the market to rebound. Historical data illustrates (as shown below) that the stock market tends to rebound more quickly from less severe corrections.
But how can investors and traders position themselves during, and after, a market correction, aside from buying stocks?
Research conducted by tastytrade demonstrates that short option approaches have outperformed in the wake of market corrections, and may therefore be a viable choice for many investors/traders—depending on their risk profile and market outlook.
Short Options Historically Outperform After a Market Correction
Due to the dynamic nature of options, participants in the options market tend to thrive in a wide variety of market conditions. However, short options players tend to get really excited and engaged amidst market pullbacks.
During choppy periods in the financial markets, risk premiums tend to increase—as observed through increasing levels of implied volatility. In essence, that means options premiums are getting richer, and relatively more attractive to sell.
However, with markets making bigger swings, investors and traders may be more hesitant to sell options, due to the risk profile of such positions. But despite that natural hesitancy, research conducted by tastytrade suggests it’s not necessarily the risks that increase during a correction, but rather the potential rewards.
That’s because the market is unpredictable, and can theoretically make a big move at any time. Considering that reality, one would prefer to sell options premium when it’s relatively more expensive (i.e. during periods of elevated implied volatility).
But pulling the trigger to “sell fear” amid a market downturn isn’t necessarily easy. That’s one reason that objective market research is so useful, because it provides the quantitative foundation necessary to back-up a so-called gut feel.
Along those lines, the tastytrade network recently published a new market study that examines the historical success rate of a short options approach across a variety of market environments.
Spoiler alert, short options performance tended to improve as the severity of the correction intensified—primarily due to the fact that options prices are richer during these periods.
In order to evaluate this question, the tastytrade research team constructed a market study incorporating the following parameters:
- Utilized data in the SPDR S&P 500 ETF Trust (SPY) from 2005 to present
- Backtested short straddle performance (16 delta straddles) with 45 days-to-expiration
- Managed all trades at 21 days (i.e. closed each position after 21 days)
- Segmented results based on market environment (any day, any down day, 1% correction, 2% correction, 3% correction)
This series of backtests revealed that the win rates and average P/L from short straddles tended to increase along with the veracity of the correction. The image below provides a snapshot of the summarized results from the aforementioned backtests.
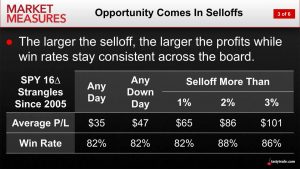
As one can see in the data above, the larger corrections tended to produce more attractive win rates and average P/Ls.
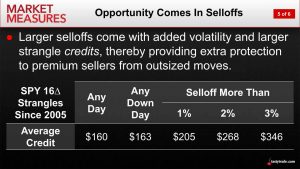
Further research conducted by tastytrade revealed that this was mostly due to the fact that option prices were higher during these periods, thus providing more protection for premium sellers, as illustrated below.
While the short premium approach has demonstrated attractive results across all market environments, this research helps illustrate why it becomes even more effective during periods of rising market volatility (i.e. corrections).
These findings dovetail well with previous tastytrade research that demonstrated the high historical success rate of selling puts in blue chip stocks after 5% corrections. To learn more about this trading approach, readers are encouraged to follow this link.
For more updated insight into the performance of short puts during selloffs, readers can also review this new installment of Market Measures on the tastytrade financial network.
To follow everything moving the financial markets in 2022, readers can also tune into TASTYTRADE LIVE—weekdays from 7 a.m. to 4 p.m. CST—at their convenience.
Sage Anderson is a pseudonym. He’s an experienced trader of equity derivatives and has managed volatility-based portfolios as a former prop trading firm employee. He’s not an employee of Luckbox, tastytrade or any affiliated companies. Readers can direct questions about this blog or other trading-related subjects, to support@luckboxmagazine.com.