The ‘Normalizing’ Yield Curve: What It Means for Investors
Decoding the Yield Curve's Recent Shift: What Lies Ahead?

- The yield curve became inverted more than two years ago when the Fed started aggressively raising benchmark interest rates.
- Yield curve inversions have historically preceded contractions in the U.S. economy, but this time a recession has yet to materialize.
- With the U.S. central bank is now poised to cut interest rates, the yield curve is starting to “normalize.”
After more than two years in an inverted state, the U.S. yield curve is showing signs of normalization.
The inversion still exists, but it’s less severe. And recent activity in the interest rates market has observers wondering if it will “un-invert” or “re-intensify.”

The importance of yield curve inversions
The yield curve offers a snapshot of interest rates (yields) across various time horizons. Typically, interest rates increase over longer durations to compensate for heightened uncertainty.
However, when economic expectations sour, the yield curve often “inverts,” with longer-dated rates declining. This phenomenon, where longer-dated yields fall below shorter-dated ones, is referred to as an “inversion” of the yield curve.
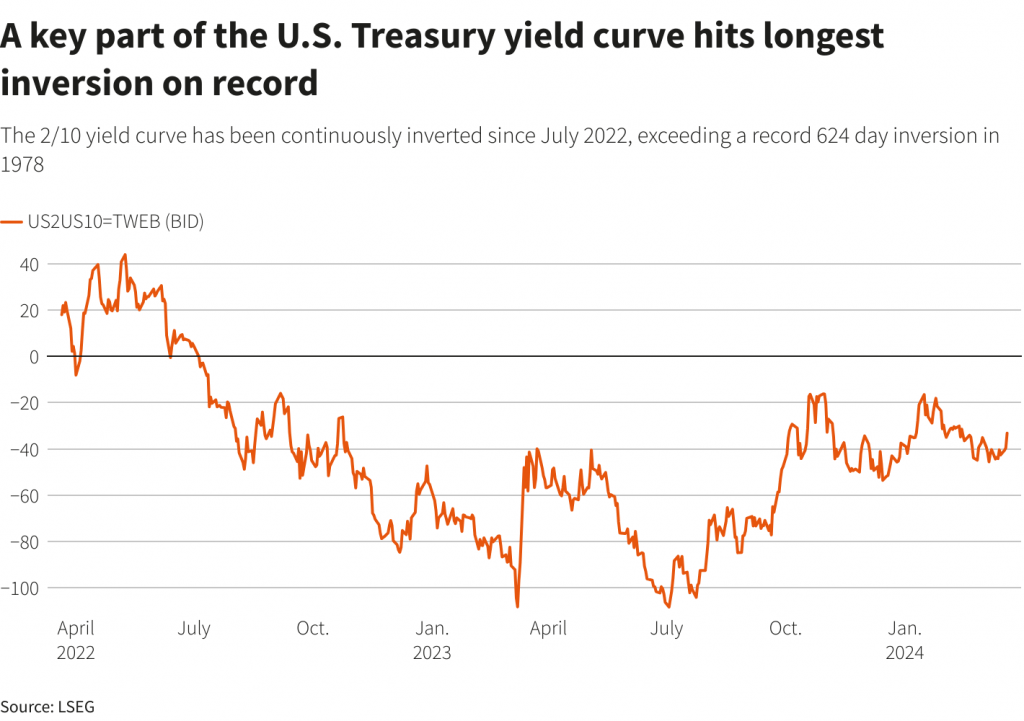
The current inversion has historical significance because of its duration. One of the longest in history occurred back in the late 1970s and lasted almost two years. But the this one has already eclipsed the two year mark, having started in July 2022, according to Deutsche Bank research.
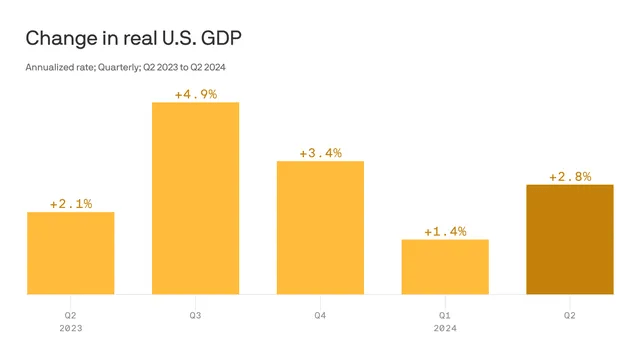
Another critical aspect of the ongoing inversion is its economic context. Historically, yield curve inversions have preceded economic recessions. Yet, this inversion has defied that pattern. Since the onset of the current inversion, the U.S. economy has not experienced a single quarter of negative growth in the gross domestic product (GDP).
In fact, GDP grew by a robust 2.8% in the second quarter of 2024. So, what happens next?

The yield curve has been normalizing
When measuring inversions, analysts often examine the two-year and 10-year Treasury yields—both heavily traded U.S. government bonds.
Under normal circumstances, the 10-year Treasury yield trades above the two-year Treasury yield because investors typically demand added return for the uncertainty associated with a longer-dated investment.
But because of the inversion, the 10-year Treasury yield has fallen below the two-year. Today, the 10-year yields 4.03%, which is less than the 4.25% yield of the two-year. That equates to an inversion of 22 basis points (4.25 – 4.03 = 0.22).
But over the last couple of years, the inversion has been more severe. At times, it traded in excess of 100 basis points. That means the intensity of the inversion has moderated. And this “normalization” process (aka “flattening”) sheds light on the current dynamics in the broader interest rates market.
The normalization process usually follows one of two paths. Either the shorter-dated yields decline more rapidly than the longer-dated yields, or the longer-dated yields rise more quickly than the shorter-dated yields. This distinction is important because the market forces acting upon the yields can provide further context on the broader rates market.
What it all means
Today, the latest shift in the yield curve appears to be driven by the second scenario—longer-dated yields rising more quickly than shorter-dated yields. This is significant for two reasons.
First, it suggests the market expects the Federal Reserve to maintain higher interest rates for an extended period. Even if the Fed begins to cut rates, investors anticipate a gradual process, hence the rise in longer-dated yields.
Some interpret this as relatively good news because it indicates the Fed may not need to slash rates quickly—a situation typically arising when the central bank is worried about an imminent recession. On the other hand, that probably means interest rates will remain higher for longer. And that’s not necessarily great news for consumers and businesses that have been pining for lower borrowing costs.
For the stock market, however, an extension of the status quo may not be the worst outcome. Corporate earnings have been strong in recent quarters despite the existence of elevated interest rates. And that’s been reflected in rising stock prices.
In contrast, the alternative scenario would arguably be worse for valuations in the stock market. For example, if shorter-dated yields were falling more quickly than longer-dated yields, that might indicate the Fed was expected to make some aggressive near-term cuts to interest rates. And this type of activity often accompanies a significant contraction in the underlying economy.
Traditionally, economic recessions have coincided with sharp pullbacks in the stock market. Therefore, of the two potential scenarios, the current one might be more favorable. It also suggests the elusive “soft landing” might be achievable. However, neither scenario is guaranteed, as outlined below.

The contrarian trading angle
The yield curve has historically been a reliable predictor of recessions, but as seasoned active investors know, past performance is no guarantee of future results. This time, a recession may not materialize, even after such an extreme inversion of the yield curve.
Similarly, predicting whether the yield curve will continue to narrow is challenging because the current level (22 basis points) is not a historical extreme. Nevertheless, the situation illustrates how a historic inversion in the yield curve provided an attractive trading opportunity for contrarians.
Mean-reversion trades involve betting that a market variable will revert to its long-term average or “normal” state after reaching an extreme. In the case of the yield curve, when it inverts to an extreme level, traders who expect it to revert to a more typical upward slope are therefore engaging in a mean-reversion trade.
Before the yield curve inversion in July 2022, this pairs trade (e.g. spread trade) would have been deployed by taking on upside exposure to near-term yields, while taking on downside exposure to longer-term yields. Alternatively, the opposite trade could have been initiated when the inversion reached an historic extreme, at more than 100 basis points.
Taken all together, the situation in the yield curve helps underscore why historical extremes are so important to mean-reverting relationships—whether it be the yield curve, the gold/silver ratio or implied volatility in the options market. To learn more about trading shifts in the yield curve (e.g. interest rates), readers can check out this installment of Market Measures on the tastylive financial network.
Andrew Prochnow has more than 15 years of experience trading the global financial markets, including 10 years as a professional options trader. Andrew is a frequent contributor of Luckbox Magazine.
For live daily programming, market news and commentary, visit tastylive or the YouTube channels tastylive (for options traders), and tastyliveTrending for stocks, futures, forex & macro.
Trade with a better broker, open a tastytrade account today. tastylive, Inc. and tastytrade, Inc. are separate but affiliated companies.


