A Prognostication Tool
Standard deviations can help predict the price of futures anytime between listing and expiration
Futures contracts lock in the price of a commodity or index. The former can include oil, gold, soybeans or wheat, while the latter can include the S&P 500, U.S. Treasury Bond yields or foreign exchange rates.
By design, futures eventually settle to the published price of the underlying they track. But how can traders predict the price of a future at any point between the time it’s listed and the time it expires?
Fortunately, several statistical measures can help. One of the most useful is standard deviations, which traders often refer to as historical volatility. Standard deviations capture spread size compared with mean value.
In a normal distribution, one standard deviation captures 68.2% of the values around the mean. Two standard deviations capture 95.4%, and three standard deviations capture 99.6%. (See “Standard moves,” below.)
By capturing the average move and the variability around it, standard deviations provide traders with a reference point for how much an underlying typically moves over a given period.
While standard deviations don’t provide insight into the direction of movement, they help set expectations for a trade’s potential profit and loss and may reveal opportunities.
So, how should traders use standard deviations? Let’s look at one of the most popular and volatile futures markets: crude oil.
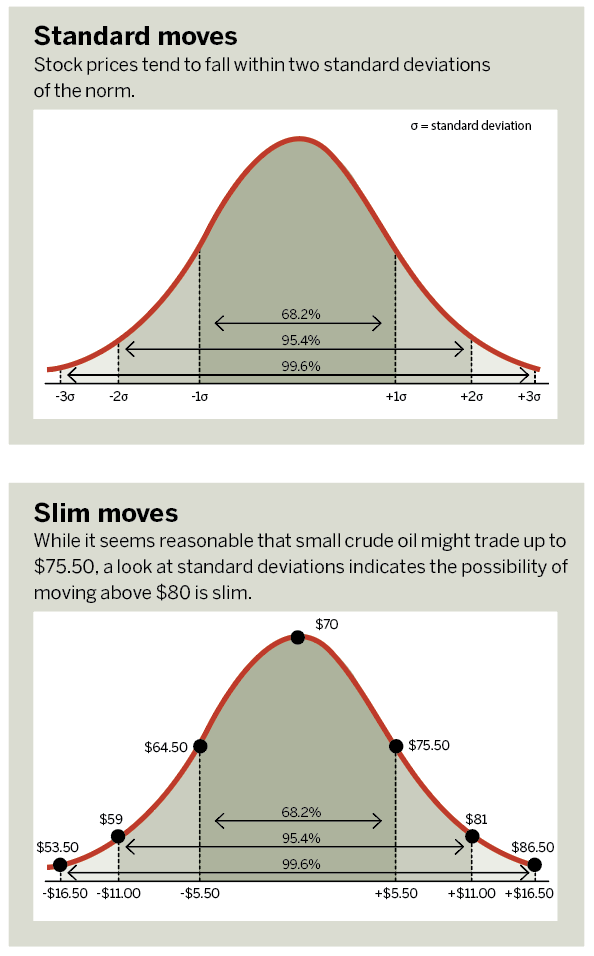
At the time of this writing, small crude oil futures are trading for around $70 per barrel. Is it reasonable to expect $80 crude oil by the end of the next month? What about $90?
Well, the last several months of historical data show that roughly 68% of the time (one standard deviation) the one-month move in small crude oil was within +/- $5.50. And 95% of the time (two standard deviations) the one-month move was within +/- $11.
The one-, two- and three-standard deviation monthly moves in small crude oil are depicted in “Slim moves,” right.
While it seems reasonable that small crude oil could trade up to $75.50, the possibility of moving above $80 over the next 21 trading days appears slim. Those levels are valuable for setting entry points, profit and loss targets, and realistic expectations before entering any trade.
As another example, suppose small crude oil sinks from $70 to $60. Contrarians could view that as a grossly oversold market because the price moved roughly two standard deviations lower. If they buy in at $60, they may look to make a $2 or $3 profit or cut their losses at $2 to $3 after a few days or weeks, keeping in mind that the normal monthly move in the market is +/- $5.50.
The fact that standard deviations use historical data means they aren’t a perfect measure, and traders should always be aware of the possibility of outliers. However, having a statistical baseline beats trading blindly.
Michael Gough enjoys retail trading and writing code. He works in business and product development at the Small Exchange, building index-based futures and professional partnerships. @small_exchange