Long Tech, Short Financials Works Like a Charm
Looking ahead into 2024, the long tech versus short financials pairs trade offers a compelling risk-reward dynamic, especially with the stock market trending toward all-time highs
- The long tech vs. short financials pairs trade has worked to perfection thus far in 2023.
- Year-to-date, the Technology Select Sector SPDR Fund (XLK) is up 55%, whereas the Financial Select Sector SPDR Fund (XLF) is up only 9%.
- Based on existing data/sentiment, the long tech vs. short financials pairs trade offers a compelling risk-reward dynamic heading into 2024.
For those looking at new investment/trading ideas heading into 2024, the long technology vs. short financials pairs trade might be worth a look. And this structure may work especially well for those that are already long the technology sector—whether that’s via single stocks or ETFs.
Pairs are unique because they provide investors/traders with the ability to hang onto a favored bullish position (e.g. tech), while also deploying a bearish position in a sector/product with a less favorable outlook (e.g. financials).
With the new trading year on the horizon, now is a great time to consider portfolio positioning, especially with the major market indices recently stretching toward fresh all-time highs.
The intent of a pairs trade is to profit from the combined movement in the two positions. That could be a large profit in one position, combined with a small loss in the other. Or, a smaller profit from both positions.
So far in 2023, it’s been the former. The long tech trade has produced a handsome profit, while the short financials trade has produced a small loss. In many ways, an ideal result.
To wit, the Technology Select Sector SPDR Fund (XLK) is up 55% thus far in 2023, whereas the Financial Select Sector SPDR Fund (XLF) is up only 9%. That means the long position in XLK has produced a large gain, while the short position in XLF has produced a small loss.
That’s true whether the pairs trade was structured 1:1, or 1:4. The latter structure would be appropriate for those seeking to scale the trade in equitable fashion, because at the start of the year, shares of XLK were roughly four times as valuable as shares of XLF.
XLK started the year trading roughly $123/share and has since risen to a value of about $191/share. That means an investor who bought 1,000 shares of XLK in early January has made a profit of about $68,000 to date.
On the other hand, XLF started the year trading at roughly $34.32/share and is currently trading $37.35/share. That means shorting 1,000 shares of XLF would have resulted in a loss of around $3,000, while shorting 4,000 shares would have resulted in a loss of around $12,000.
Therefore, the net result of the XLK-XLF pairs trade—executed in 1:1 fashion—has been a $65,000 profit ($68,000 – $3,000 = $65,000). Alternatively, the same pairs trade structured in 1:4 fashion (to better balance the delta exposure of the trade)—has produced $56,000 in profit ($68,000 – $12,000 = $56,000).
Why the XLK-XLF pair still looks attractive heading into 2024
Looking ahead into 2024, the XLK-XLF pairs trade still looks attractive, especially for those investors that are already long the tech sector.
This structure looks attractive not only because of the respective outlooks for each market sector, but also because the major market indices recently climbed toward fresh all-time highs.
Pairs trades work most efficiently when the two underlyings share a strong positive correlation. During the last two months, XLK and XLK have exhibited a positive correlation of roughly 0.63.
A strong positive correlation is important with a pairs trade, because it helps insulate the combined position from the risk of a broad-based market correction. If the market corrects, both underlyings should move lower, providing the investor/trader some degree of protection from the short leg of the trade.
That scenario also helps illustrate why a pairs trade arguably becomes more attractive when the market is trending toward all-time highs. As of right now, tech stocks remain attractive due to ongoing strength in their associated fundamentals. So far this year, profits in the tech sector have been robust, especially at the top of the food chain.
For example, the average profit margin for the “Magnificent Seven” has been roughly 19% in 2023, while the average profit margin for the other 493 stocks in the S&P 500 has been closer to 10%.
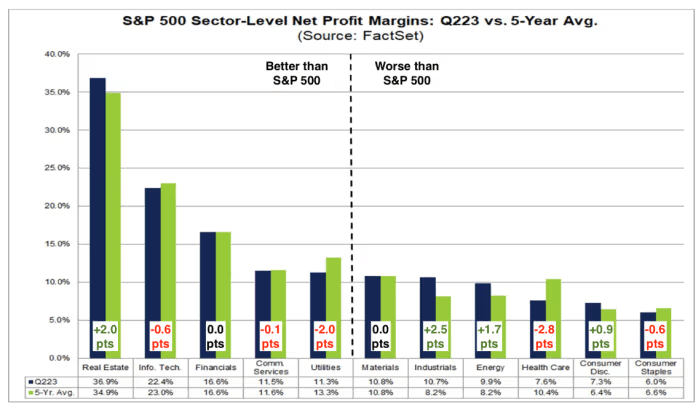
Looking at a sector breakdown, the tech sector produced a profit margin over 22% in Q2, while the financial sector has produced a profit margin of roughly 16%—both of which are comparable to their respective five-year averages.
Not surprisingly, the tech sector’s ability to produce stronger profits has also translated to higher valuation multiples.
These days, the forward price/earnings (P/E) for the tech sector is roughly 26, while the forward price/earnings for the financial sector is about 15. Both of those figures represent a premium with respect to the five-year averages. For the tech sector, the five-year average is closer to 23 and for the financial sector, it’s closer to 13.
From this perspective, one could argue that both sectors are slightly overvalued, which probably isn’t a big surprise given that the major indices are sitting near record highs. That said, the forward price/earnings for the overall S&P 500 is hovering around 19, which is below its recent peak of 22.
The forward price/earnings ratio allows investors to look at an investment’s market price in the context of the earnings that the investment is projected to produce. For example, 19x forward earnings implies that it would take 19 years for the S&P 500 index to produce income equal to its current market capitalization.
Based on the aforementioned data, the overall S&P 500 doesn’t necessarily appear to be overvalued at this time, despite the fact that it is trading near all-time highs.
Long tech vs. short financials: Additional considerations
With the major market indices trending toward fresh all-time highs, there’s an argument to be made that investors and traders would be prudent to trim long equities exposure at this time.
Alternatively, investors and traders could initiate a new bearish position in their portfolios to help offset existing long exposure. One way to do so would be to pair an existing long tech position with a short position in the financials.
A position such as this arguably provides additional protection from the risk of a correction in the financial markets, especially for investors and traders who were planning to hold onto their long tech positions. With this pair in place, the short financials component of the trade theoretically provides additional insurance in the event of broad-based market selloff.
On the other hand, if the stock market continues to rally, it’s virtually assured that the tech sector will continue to outperform the financials, as it has done for some time. Over the last five years, the XLK is up about 223% while the XLF is up closer to 63%.
As of late 2023, the tech sector continues to shine, while the financial sector faces a significant wall of worry. The financial industry was besieged by a regional banking crisis earlier in the year. Some have recently argued that the worst may still be yet to come.
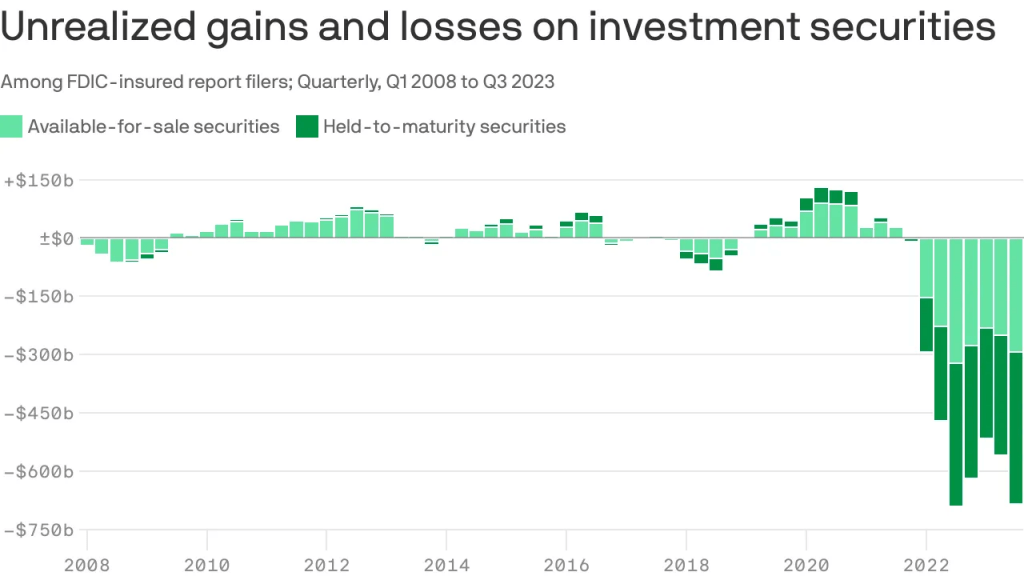
On top of that, U.S. financial institutions are sitting on a mountain of unrealized losses.
Recently, the Federal Deposit Insurance Corporation (FDIC) estimated that total unrealized losses at FDIC-insured banks had risen to nearly $700 billion. Those losses represent the difference between what these institutions paid for their holdings of government bonds as compared to the current market prices of those bonds.
Additionally, a recent analysis indicated that profit margins in the financial industry could come under pressure in 2024, which further detracts from the relative attractiveness of the sector. In contrast, revenues and earnings in the tech sector are projected to strengthen next year.
Considering all of the above, investors and traders who want to continue to ride potential upside in the tech sector may want to pair that bullish outlook with a short position in the financials. In 2023, that trade worked to perfection and based on current data/sentiment, it could produce favorable results again in 2024.
For this particular trade structure, the worst case scenario is that the financials outperform tech stocks. Considering the five-year returns in each of those industries, that seems like a fairly remote possibility.
On the other hand, if the stock market shifts into correction mode, the short financials trade would help offset losses stemming from the long tech trade. This scenario is especially relevant with the major market indices currently hovering near all-time highs.
All told, the risk-reward dynamics of the long tech versus short financial pairs trade appear favorable at this time. But investors and traders new to pairs trading may want to mock trade”= (i.e. paper trade) this idea before deploying it live in the markets.
Mock trading allows investors and traders to learn how a new trade strategy behaves without the risk of capital losses.
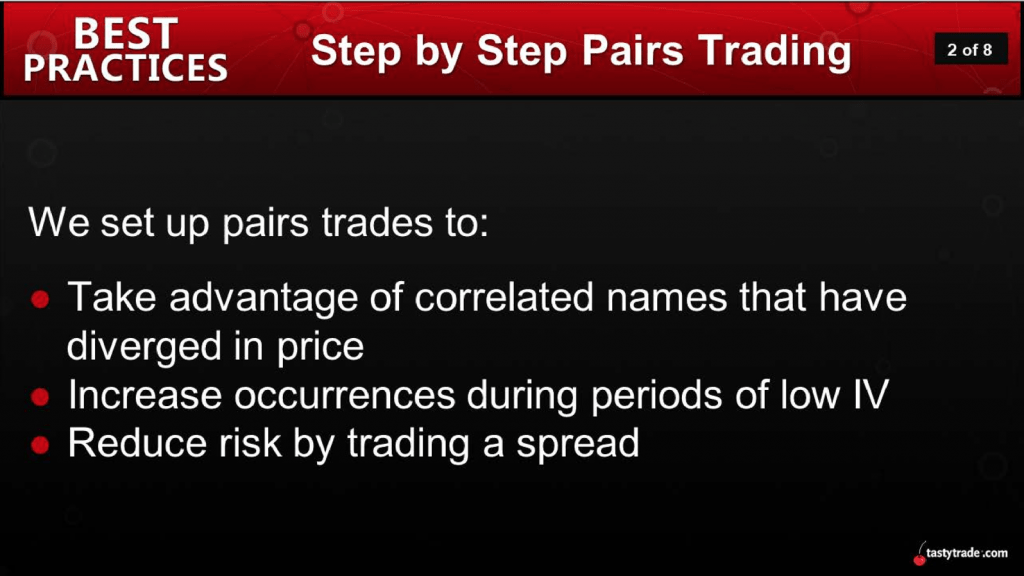
For more background on pairs trading, check out this installment of Best Practices on the tastylive financial network. To follow everything moving the markets, readers can also tune into tastylive—weekdays from 7 a.m. to 4 p.m. CDT.
Andrew Prochnow has more than 15 years of experience trading the global financial markets, including 10 years as a professional options trader. Andrew is a frequent contributor Luckbox Magazine.
For daily financial market news and commentary, visit the News & Insights page at tastylive or the YouTube channels tastylive (for options traders), and tastyliveTrending for stocks, futures, forex & macro.
Trade with a better broker, open a tastytrade account today. tastylive, Inc. and tastytrade, Inc. are separate but affiliated companies.