Is it Time to Buy Options? Volatility Tells
While some traders use options to make directional bets via so-called “naked options,” many use derivatives to express opinions on implied volatility.
Implied volatility has historically exhibited a tendency to mean revert, meaning high levels of implied volatility tend to decline back toward the historical mean, and low levels of implied volatility tend to rise toward the historical mean.
One complicating factor when trading volatility is the existence of time decay, which dictates that all else being equal, options lose value as they approach expiration (i.e. as time passes).
The fact that options decay puts additional pressure on the long volatility side of the market because while low implied volatility may at times mean-revert higher, the positive effects of this action can often be counteracted by time decay.
Another important consideration for options traders is that historically, implied volatility tends to be overstated in the marketplace. This generally occurs because options are a form of insurance, and therefore include a “premium” in their price which accounts for that insurance value.
As a reminder, implied volatility (IV) represents the current market price for volatility based on the market’s expectations for future movement in a given underlying. This value is “implied” by the dollar and cent value of options trading in the marketplace.
Realized volatility (RV), on the other hand, is the actual movement that occurs in a given underlying over a defined historical period of time. Volatility traders obviously care not only about what is expected to occur, but also what has actually transpired.
Studies of historical market data have consistently demonstrated that implied volatility tends to overstate realized volatility in the majority of instances.
For example, a study conducted by tastytrade in SPY illustrated that implied volatility has historically been overstated more than 80% of the time when compared to realized volatility, as shown in the graphic below:
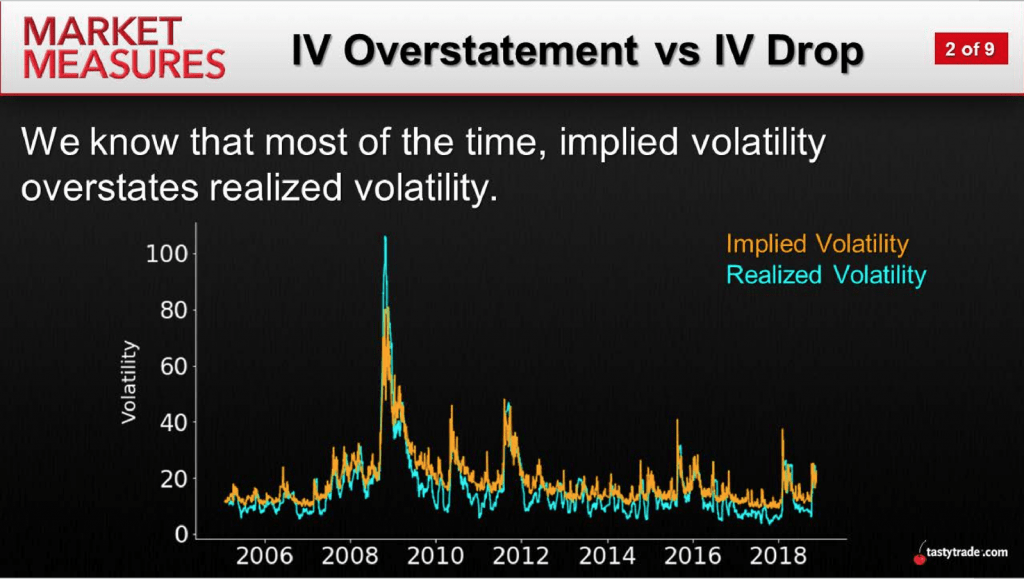
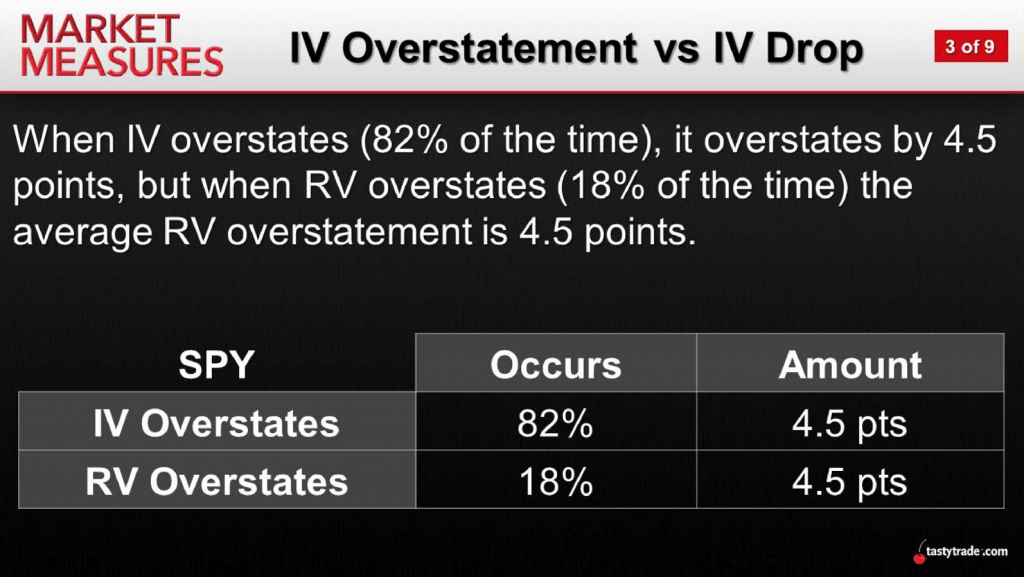
As one can see in the second slide above, the aforementioned market study revealed that in SPY, realized volatility has outpaced implied volatility only 18% of the time. And during those periods, that overstatement was represented by a 4.5 point premium.
Given that the VIX was trading in the low teens before the most recent market correction associated with the global spread of the coronavirus, it’s likely clear to most options traders that realized volatility outpaced implied volatility during late February and early March.
After a long bull run over the past few years, characterized by extremely low levels of realized volatility, the financial markets simply weren’t pricing in the type of moves observed in equity markets during the last several weeks.
Based on these market conditions, many traders are likely currently wondering whether or not to purchase options premium—whether it be to hedge an existing portfolio, as a directional play, or based on an expectation that markets will continue to exhibit elevated levels of volatility.
Such a decision is, of course, dependent on a trader’s unique market outlook, risk profile and trading approach.
However, prior to making such a decision, traders may want to review a recent episode of Market Measures on the tastytrade financial network.
This installment of the popular series focuses on the typical behavior of long volatility in the wake of a severe correction, which is particularly prescient given that this situation is arguably playing out at this exact moment.
In order to produce the necessary data for this analysis, the tastytrade research team examined historical trading data from the last major Financial Crisis (2008-2009).
As illustrated in the two slides below, one can see that realized volatility did outpace implied volatility at the start of the 2008-2009 market correction, much like what has been observed at the outset of the current “Coronacrisis.”
However, one can also see that after the initial shock to the markets in 2008-2009, the IV-RV paradigm did return to normal—that is to say that implied volatility once again began to consistently overstate realized volatility:
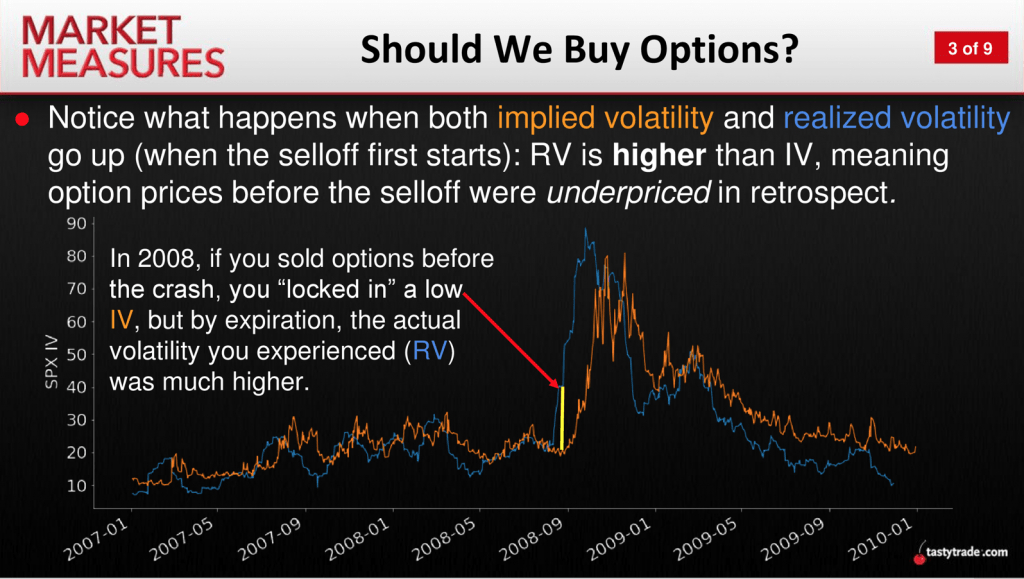
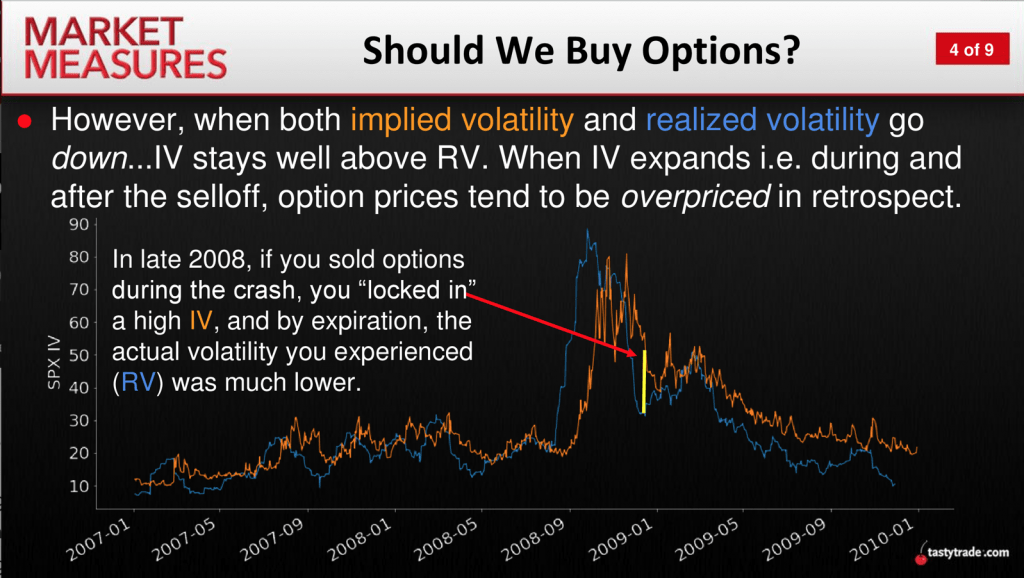
From the above, one can see that long options (i.e. long volatility) positions benefited greatly if they were deployed prior to the 2008-2009 market correction. However, timing that purchase to correspond with the correction is a lot harder to quantify in terms of likelihood.
A natural follow-up question is therefore how well a short volatility approach performed in the wake of the initial spike in implied volatility.
Based on the fact that realized volatility eventually dropped below implied volatility in the previous crisis, one might hypothesize that short volatility positions outperformed as the implied volatility contracted.
In order to answer this question, the tastytrade research team backtested market data in SPY from 2007 to 2009. The backtest included a 30 delta short strangle in SPY with on average 45 days-to-expiration.
The historical data was then filtered into two different groups: instances in which the VIX was below 20, and instances in which the VIX was above 50.
As one can see in the summarized data below, these backtests revealed that trades made after the initial correction, when the VIX was above 50, tended to produce outsized, positive returns. Likewise, one can also see that the short strangle underperformed when the VIX was below 20, as might be expected.
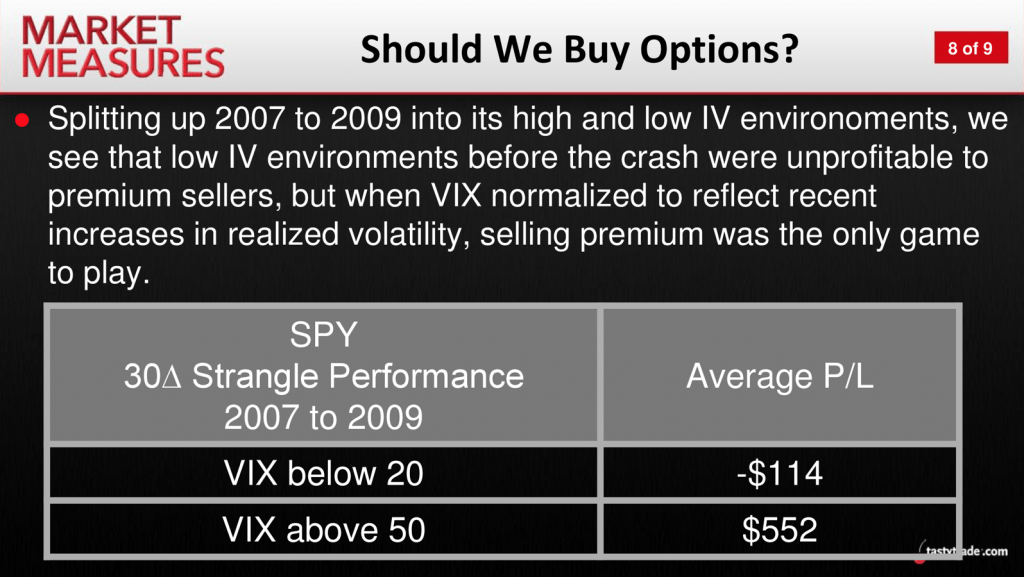
Looking at the data above, one can see that the short premium value proposition was strongest in the wake of a severe correction.
While this information may not dictate the choices traders make in the current environment, it should at least help market participants better understand how different trading approaches performed during the last crisis.
Certainly, the current Coronacrisis won’t play out in the exact same way as 2008-2009. However, it’s also certain that elevated levels of implied volatility will eventually mean revert.
Traders seeking to learn more about how implied volatility behaved relative to realized volatility in the last market crisis may want to review the complete episode of Market Measures when scheduling allows.
Additional information on the historical overstatement of implied volatility relative to realized volatility can also be reviewed using this link.
Sage Anderson is a pseudonym. The contributor has an extensive background in trading equity derivatives and managing volatility-based portfolios as a former prop trading firm employee. The contributor is not an employee of Luckbox, tastytrade or any affiliated companies. Readers can direct questions about topics covered in this blog post, or any other trading-related subject, to support@luckboxmagazine.com.


