Probabilities Don’t Lie

“Occurrences” when trading volatility typically refers to the total number of trades deployed over a given period of time (one year, for example).
Because volatility trading relies so heavily on mathematical probabilities, it stands to reason that the likelihood of reaching those probabilities increases along with the number of occurrences.
For example, if you flip a coin five times, there’s a chance you could get all heads or all tails. However, if you flip a coin 10,000 times, it becomes a lot more likely that the chance of getting either reflects the expected 50-50 probability.
Likewise, it’s entirely possible that a trader could lose on a single trade, even if the trade itself has a high probability-of-profit (POP). On the other hand, if we deploy 100 trades with high POP, the chances of reaching our target win rate improve dramatically. That is why we are so probability-obsessed. Ultimately, probabilities don’t lie.
Traders seeking to learn more about how occurrences can affect portfolio P/L would be well-served in reviewing a recent episode of Market Measures on the tastytrade financial network. The show highlights recent tastytrade research on the subject, which essentially illustrates how confidence in expected P/L increases as occurrences rise.
While many may already be familiar with this line of thinking, the purpose of the show isn’t to rehash superficial information. Instead, the research presented on Market Measures clarifies why this occurs and presents a sample range of P/L expectations taken from actual historical data that can help guide traders’ P/L expectations going forward.
The most important concept discussed on the show revolves around standard deviation, and more specifically, the standard deviation of P/L. The key is that when a trader deploys a low number of occurrences, the range of outcomes for that limited number of trades can vary greatly. This is mainly due to the fact that one or two instances within that small sample size could be subject to a “random” (i.e., outlier) outcome.
On the other hand, as the number of occurrences increases, the standard deviation of P/L outcomes theoretically gets more narrow. That’s because the impact of so-called “random” outcomes is proportionally less when compared to a deeper pool of occurrences—the same as with the coin-flipping exercise outlined earlier.
And there’s no need to accept this assertion on faith alone. On Market Measures, the hosts present hard data from a tastytrade study that clearly demonstrates how the standard deviation of expected P/L declines as the number of occurrences increases.
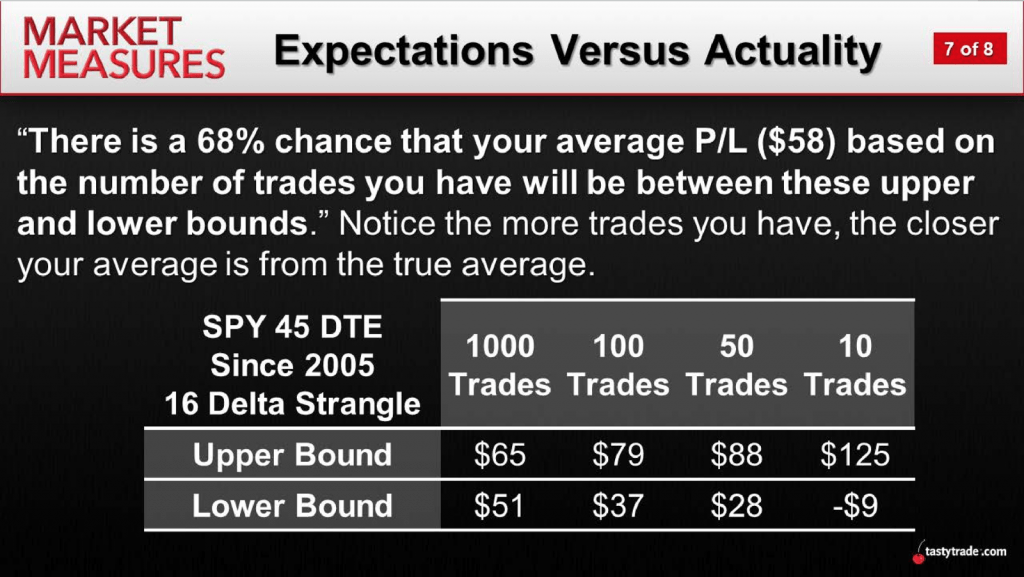
In order to produce the data necessary for this analysis, the tastytrade research team backtested a short strangle in the S&P 500 (SPY) deployed continuously since 2005. Next, the team analyzed the P/L data from each trade and produced an average “upper” and “lower” bound for this trading approach, based on the number of total instances deployed.
The chart below summarizes this analysis and illustrates clearly how the upper and lower bounds of average P/L get a lot tighter as the number of occurrences increases.

Because the results from this chart are based on historical data, they shouldn’t be interpreted as a prediction of future performance. As most traders well know, past results are not indicative of future results.
However, the data in the chart above does provide traders with a framework for thinking about how an increasing number of occurrences can shrink the variance in expected P/L. That means traders electing to deploy a statistics-based trading approach utilizing a low number of occurrences may need to adjust P/L expectations accordingly.
Due to the complexity of the subject, traders seeking to learn more about occurrences as they relate to volatility trading may want to review the complete episode of Market Measures when scheduling allows. Likewise, a new installment of Research Specials Live provides a great supplement to this material.
Click here to read more on POP, sports wagering and outlier outcomes.
Sage Anderson is a pseudonym. The contributor has an extensive background in trading equity derivatives and managing volatility-based portfolios as a former prop trading firm employee. The contributor is not an employee of luckbox, tastytrade or any affiliated companies. Readers can direct questions about topics covered in this blog post, or any other trading-related subject, to support@luckboxmagazine.com.


