The Short Volatility Playbook
The mean-reverting nature of volatility makes it a great candidate for a portfolio, especially compared to directional bets, which typically constitute a 50-50 proposition.

Hindsight illustrates that since the market bottomed in March 2020, picking market direction has been a lot easier than usual. Based on the performance of broad-market indexes, such as the Nasdaq and S&P 500, the market seemingly goes up every day.
While this pattern has certainly paid dividends for bullish positions, savvy investors and traders know that paradigm won’t last forever. Looking back at long-term historical market data, the chance that a given stock index goes up or down on a given day is much closer to a 50-50 proposition.
For example, previous research conducted by tastytrade revealed that from 1985 to 2016, the S&P 500 increased on 54% of trading days and declined on 46% of trading days. The possibility that the S&P 500 would go up or down on a given trading day is broken down in greater detail below:
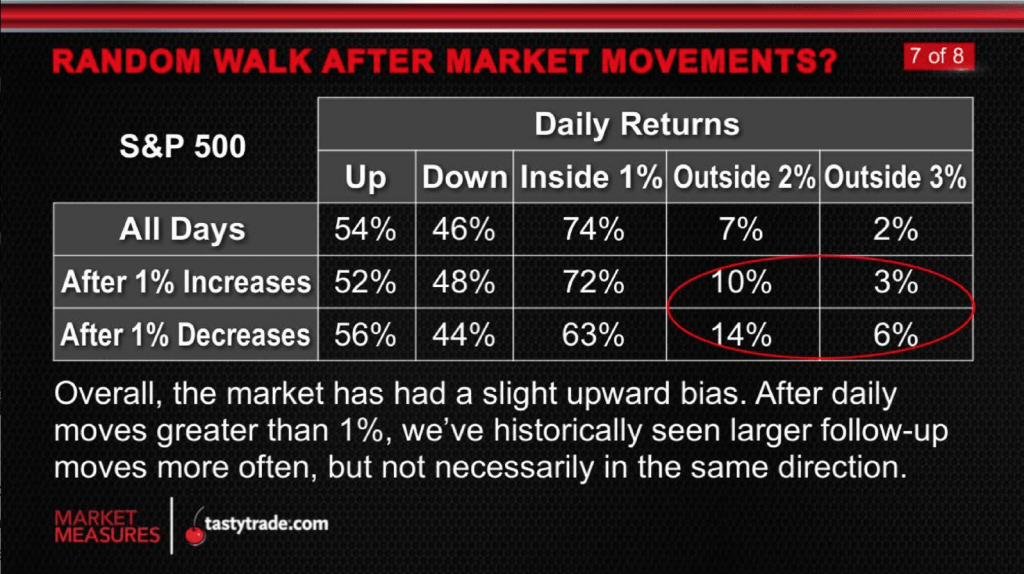
The above helps illustrate that at some point, the U.S. stock market may return to a pattern in which it becomes a lot more difficult to successfully pick direction on a daily basis. This, in turn, serves as an important reminder as to why many investors and traders focus on market volatility (using options), as opposed to market direction.
As it relates to options trading, volatility measures how much the price of a given financial instrument fluctuates over time. Volatility can therefore be an important indicator of risk—higher average relative volatility indicates a security’s returns are spread out over a larger range.
In the market, one can observe the relative differences in volatility quite easily. For example, it’s easy to see that the underlying price of Tesla (TSLA) stock fluctuates a lot more than ExxonMobile (XOM). But this risk dynamic isn’t necessarily reflected through the absolute share price, but through the implied volatility of the stock’s options.
Options are of course priced in dollars and cents in the market, but that value can be translated into a volatility price. Using implied volatility, investors and traders can therefore ascertain the expected range of a given stock over a set period of time.
For example, imagine hypothetical stock XYZ is trading at $50, and the implied volatility of an option contract is 20%. That implies there’s a consensus in the marketplace that a one standard deviation move over the next 12 months will be plus or minus $10 (20% of the $50 stock price equals $10).
Standard deviation, in this context, refers to the expected average move of the underlying over the 12 month period. According to statistical theory, a stock should trade in a one standard deviation range 68% of the time, a two standard deviation range 95% of the time, and a three deviation range 99% of the time.
That means if XYZ started the year at $50, it would be expected to close the year between $40-$60, with a 68% likelihood. And to close the year between $30-$70 with a 95% likelihood. Moreover, it suggests there’s a 99% chance that XYZ would close the year trading between $20 and $80.
One can see how a relatively elementary understanding of implied volatility can provide investors and traders with powerful insight into the relative risk of a given stock or exchange-traded fund (ETF) through the expected movement (i.e. volatility).
However, the true power of volatility trading doesn’t necessarily lie with the absolute level of implied volatility, but rather its mean-reverting nature.
Mean-reversion, as it relates to options trading, refers to the tendency of volatility to move toward its average over time. This is important because the implied volatility of a given underlying isn’t static, it moves along with the market’s expectations.
For example, if the market entered an extremely volatile period, implied volatility in XYZ might rise from 20% to 30%. That in turn would indicate that a potential one standard deviation move in XYZ had increased from $10 to $15 (20% of $50 = 10, 30% of $50 = $15).
So instead of a 68% chance of XYZ closing the year trading between $40-$60, the market would now be implying there’s a 68% chance XYZ closes the year trading between $35-$65. One can see how that change in implied volatility provides a trader or investor with important insight into the market’s ever-changing perception of risk.
Moreover, because implied volatility is mean-reverting, it’s also possible that when implied volatility reaches an extreme in its historical range, there may be an opportunity to deploy a volatility-based options position.
For example, imagine the average level of implied volatility in XYZ is 20%, but the low and high over the last 12 months was 10% and 30%, respectively. If volatility in XYZ were to jump to 30%, a volatility trader might decide to sell volatility (i.e. sell options) in XYZ to take advantage of a potential reversion to the mean.
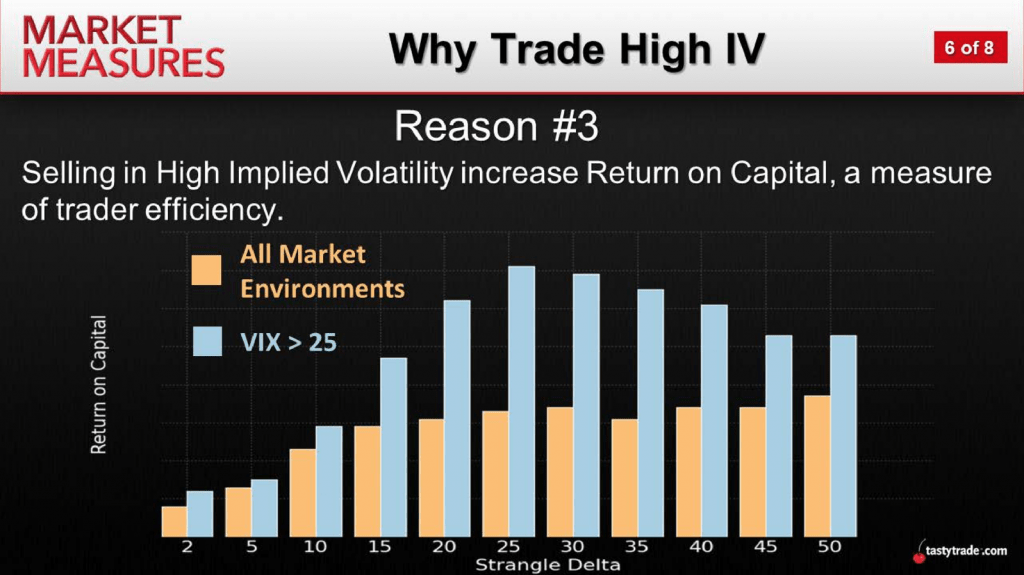
Likewise, if implied volatility in XYZ were to drop to 10%, a volatility trader might decide to buy volatility in XYZ. One caveat to buying volatility is the existence of time decay—the rule that options lose value with the passing of each day, all else being equal.
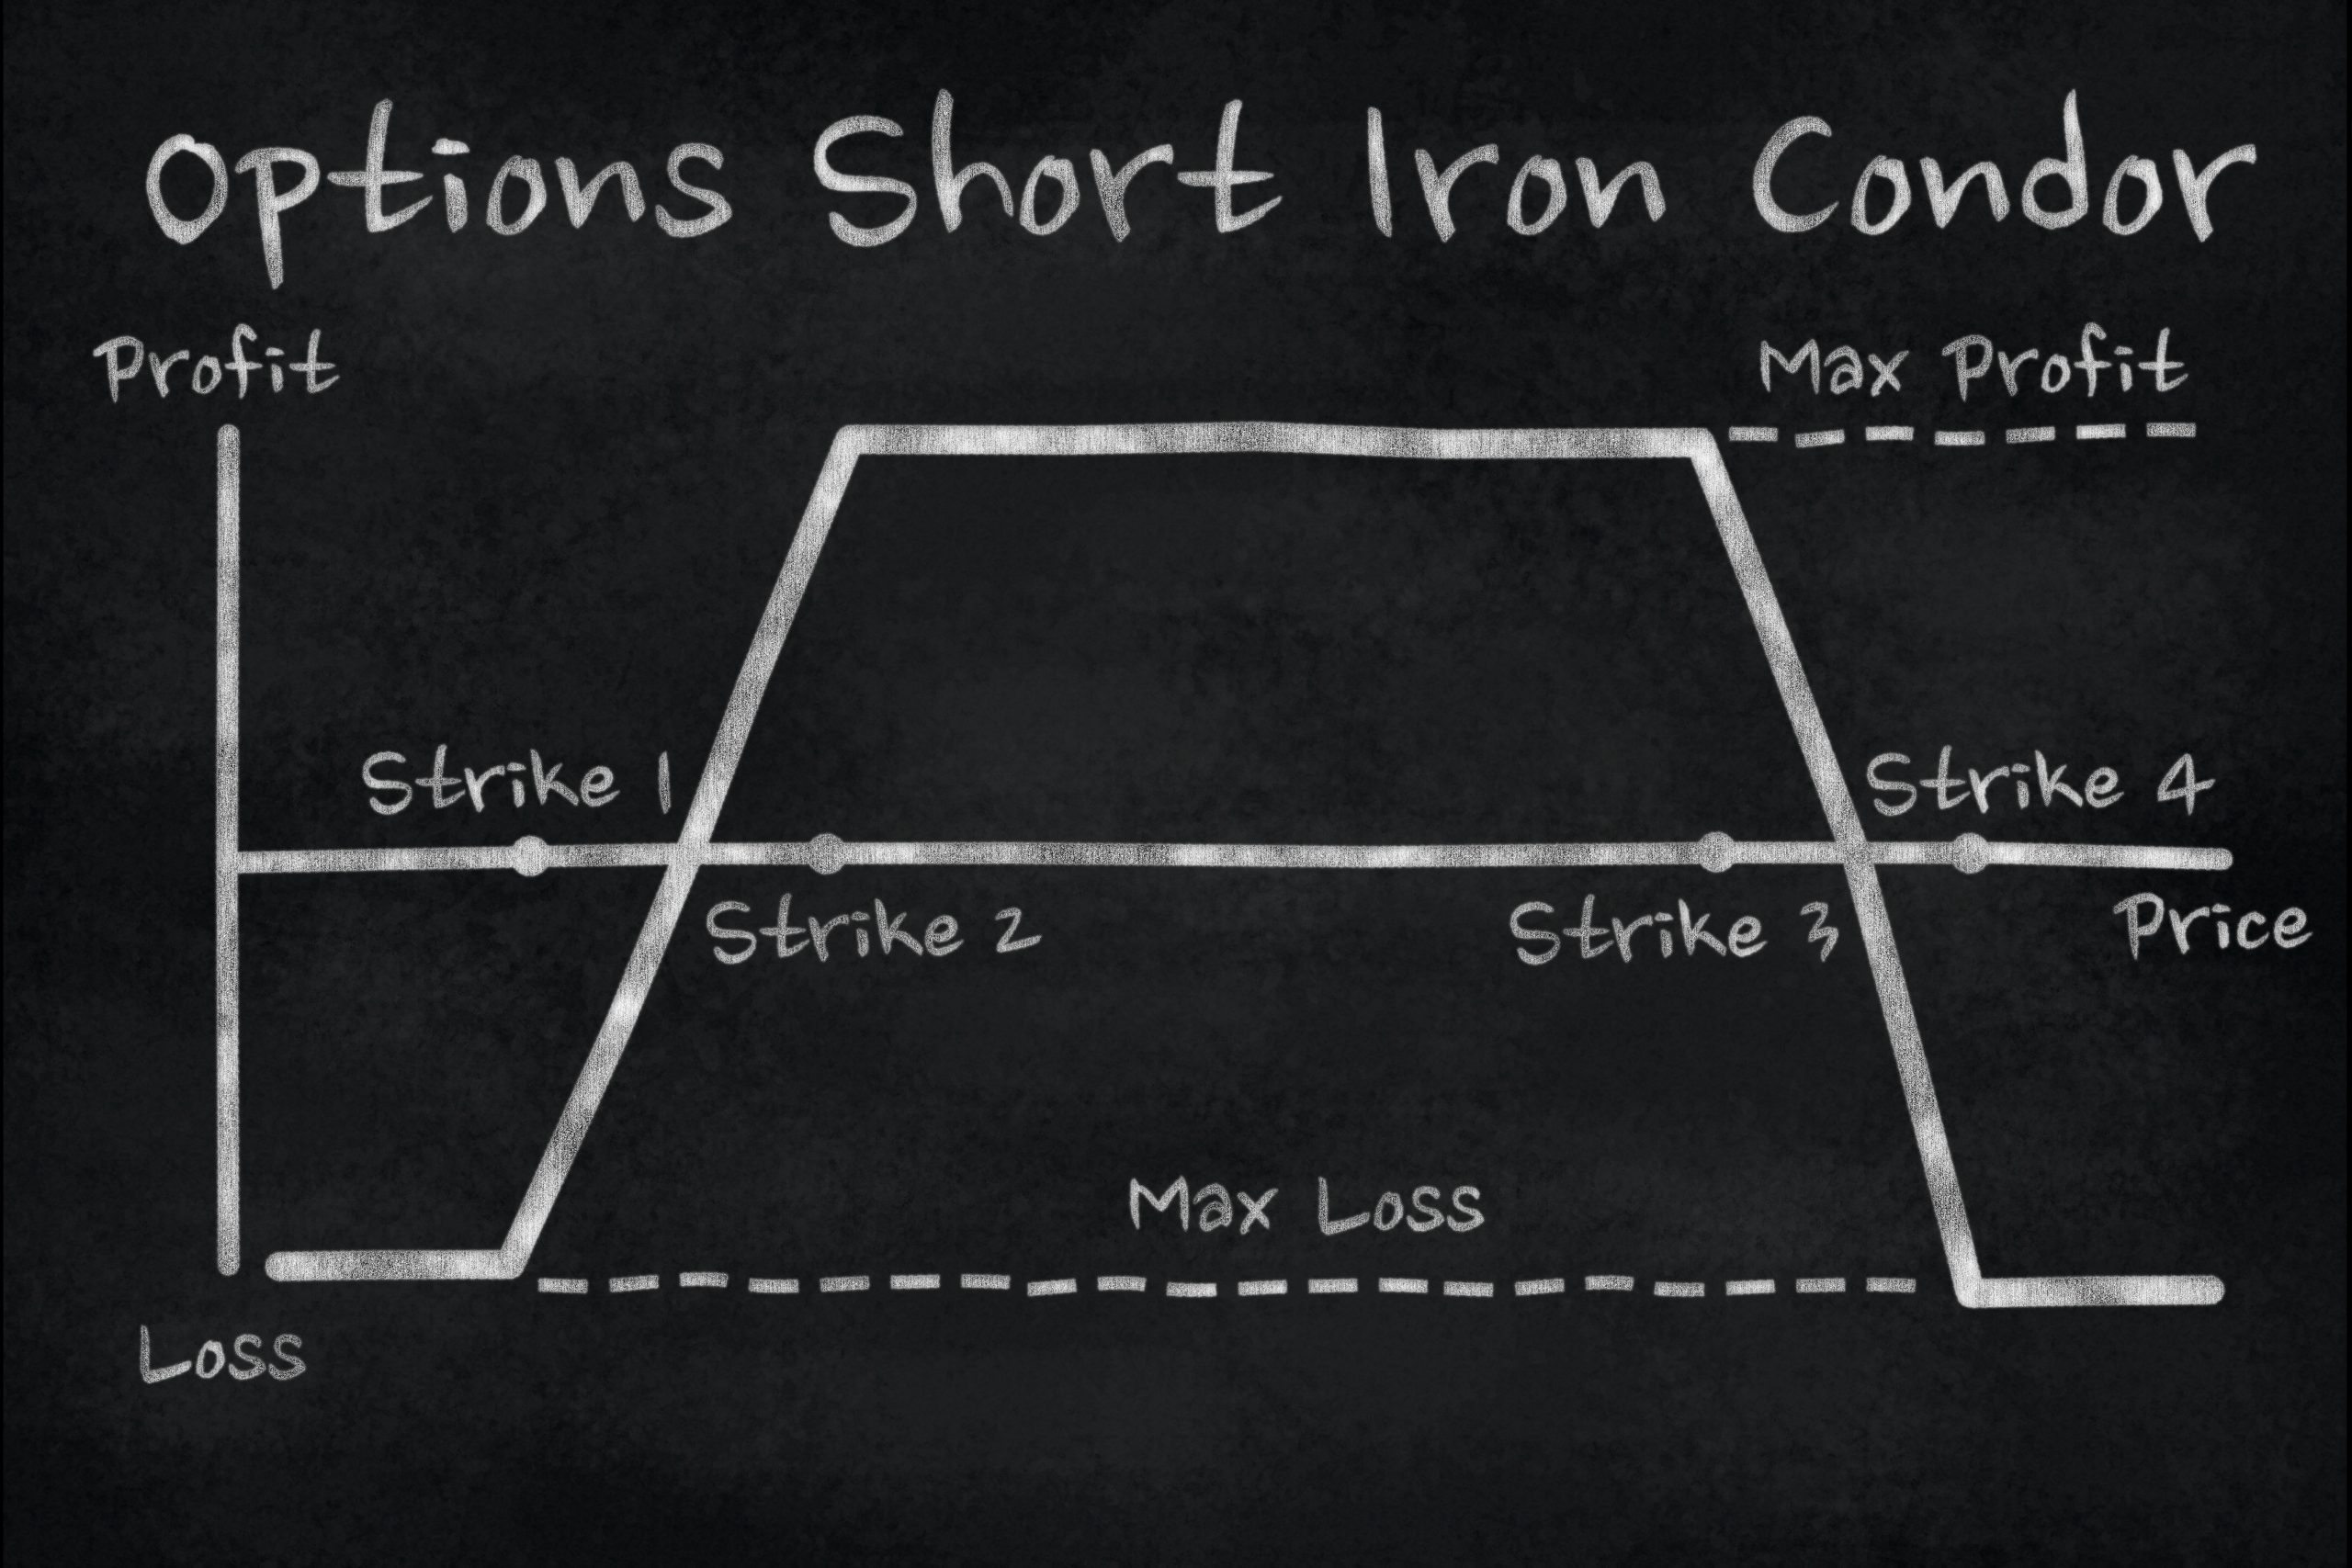
Historical market studies clearly illustrate that the probability of success for short options (i.e. short premium) positions are considerably higher than for long options (i.e. long premium) positions.
However, one must keep in mind that the potential risks and rewards of each respective position—long options vs. short options—also vary greatly. Anyone considering trading market volatility using options therefore needs to spend time familiarizing themselves with the product, and even “mock trading” (i.e. paper trading) options before deploying them live.
The tastytrade financial network maintains an extensive archive of information and research relating to options and volatility trading, which can be accessed easily through the tastytrade website. Information on additional products, such as futures and associated futures options, is also available.
On top of that vast archive, new programming is released daily via TASTYTRADE LIVE. Readers are encouraged to tune into tastytrade live, weekdays from 7 a.m. to 4 p.m. Central Time, when timing allows.
To learn more about the short volatility trading approach, the following episodes are also recommended:
This January, give the gift of Luckbox and get a free Luckbox T-shirt! See SUBSCRIBE or UPGRADE TO PRINT (upper right) for more information.
Sage Anderson is a pseudonym. The contributor has an extensive background in trading equity derivatives and managing volatility-based portfolios as a former prop trading firm employee. The contributor is not an employee of Luckbox, tastytrade or any affiliated companies. Readers can direct questions about any of the topics covered in this blog post, or any other trading-related subject, to support@luckboxmagazine.com.


