Trading the CBOE Skew Index
Skew is an options trading term that describes the fact that the implied volatility of options on the same underlying and in the same expiration are different from strike to strike.
You may have already noticed when looking across the strikes in a given expiration month that different strikes have different implied volatilities. If skew is “normal,” you will see the puts generally trading at a slightly higher implied volatility than calls. A quick review of out-of-the-money puts versus out-of-the-money calls in any given symbol should illustrate this reality quite clearly.
Market participants generally fear downside risk to a greater degree than upside risk, which is why demand-supply in the options market creates this “skewed” pricing model. The natural market flow in the options markets also supports this framework—institutions often protect their portfolios through put purchases (inflating put prices) while attempting to lower cost basis via call sales (deflating call prices).
On top of all that, skew also helps account for the fact that markets crash down more frequently than they do up—meaning puts are more firmly bid than calls because of the extra risk premium inherent in these contracts.
While we know skew exists by looking at the options market, skew is also measured more formally. The CBOE Skew Index (SKEW) measures the degree of skew observed in the marketplace. Simply stated, as put buying intensifies relative to calls in the S&P 500, the Skew Index rises. Under the reverse scenario (call buying intensifies relative to put buying), the Skew Index drops.
For reference, the Skew Index incorporates a scale from 100 to 150 to measure the perceived likelihood of a two standard deviation move in the S&P 500. A reading of 100 indicates that trading activity is fairly balanced in terms of call and put buying. On the other hand, a reading of 140-150 indicates that put buying has intensified significantly as compared to call buying.
Because skew can be measured over time, the research team at tastytrade decided to take a closer look at historical data in the Skew Index, as well as in SPY, to see if any helpful patterns emerged.
Fortunately, there was some rather interesting data that emerged from that examination.
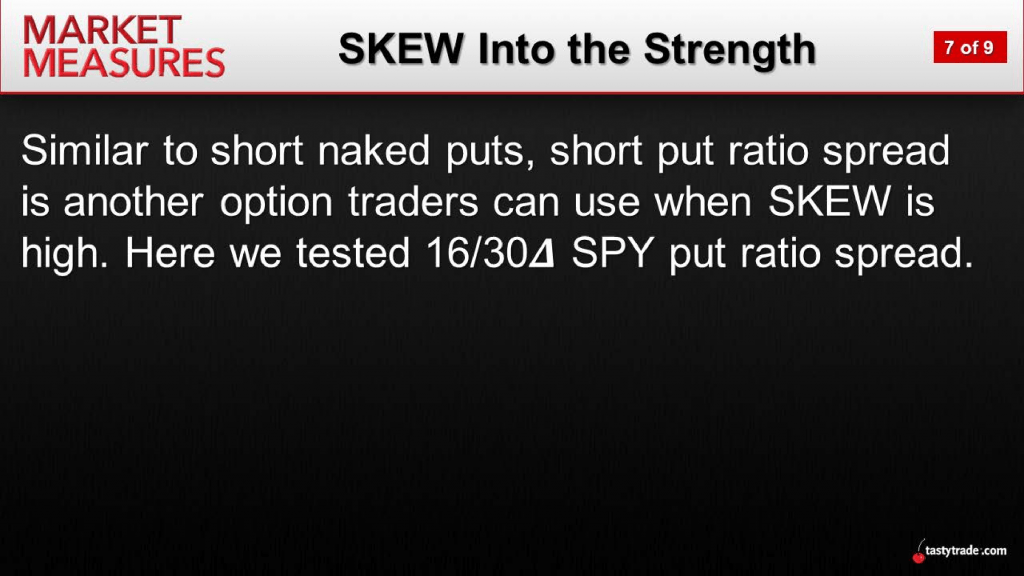
The research essentially demonstrated that a simple short premium approach (selling puts) produced more attractive win rates and average position P/Ls when the Skew Index was elevated (i.e. 130 or 140) as compared to “all environments.” This information is summarized in the graphic below:
Traders looking for a complete rundown of the aforementioned research may want to review the complete episode of Market Measures on the tastytrade financial network when their schedules allow.
In the meantime, it may be advisable to add SKEW to your watchlist, as this can serve as an important barometer of overall fear in the marketplace. As noted on Market Measures, the Skew Index is not discernibly correlated to the VIX, which means it can serve as a complementary barometer of risk in the marketplace.
Sage Anderson is a pseudonym. The contributor has an extensive background in trading equity derivatives and managing volatility-based portfolios as a former prop trading firm employee. The contributor is not an employee of luckbox, tastytrade or any affiliated companies. Readers can direct questions about any of the topics covered in this blog post, or any other trading-related subject, to support@luckboxmagazine.com. Additional information is also available in the tastytrade LEARN CENTER.
