What to Make of All-Time Highs
When the major market indices climb to all-time highs, the VIX has historically averaged about 15, but that doesn’t mean investors and traders should abandon active risk management practices during such periods.

All-time records always grab attention—whether it be devastation from wildfires, dangerously low water levels (read: Lake Powell), or extreme highs and lows in the financial markets.
In the case of the latter, the financial markets have somehow managed to buck the negativity associated with the COVID-19 pandemic and cruise toward all-time highs in 2021.
On August 25, the S&P 500 closed within a few points of its all-time high and could be poised to set a new record in the near future. However, as highlighted recently by Luckbox, there may be more to the current market environment than meets the eye—especially as it relates to risk.
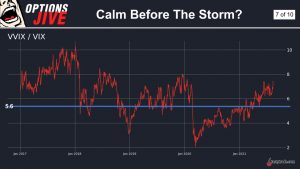
In recent weeks, the VVIX/VIX ratio has been trending toward the upper end of its historical range. That’s notable because spikes in the VVIX/VIX ratio have at times predicated corrections in the stock market.
Given that important piece of information, it’s worth taking a closer look at the characteristics of market volatility during previous all-time highs to gauge whether any other market anomalies might currently be bubbling to the surface.
Along those lines, a good starting point is the overall level of volatility observed in the market, as measured by the CBOE Volatility Index (VIX). As shown in the slide below, current readings in the VIX (about 16.5 as of August 25) closely reflect how the VIX has traded during previous all-time highs.
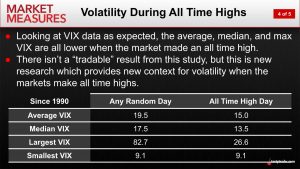
As outlined above, the VIX has historically averaged about 15 during previous all-time highs, compared to its lifetime average of about 19. With the VIX currently trading about 16.5, that suggests that the current market environment for volatility is quite similar to instances observed in the past.
Of course, when layering in current readings from the VVIX/VIX ratio, recent all-time highs don’t look quite as “normal.” Historically, the VVIX/VIX ratio tends to be lower during periods of extreme volatility and higher during periods of relative complacency—ranging between roughly 2.5 and 10.
As of today, the VVIX/VIX ratio stands at about 7.0 (117/16.5 = 7.0), suggesting that risk in the current environment is trending toward an extreme—despite a relatively benign reading in the regular VIX.
The chart below highlights historical movement in the VVIX/VIX ratio and provides insight into previous instances in which the metric hit the upper end of its range.
A big question going forward is whether investors and traders need to adjust their existing strategies in the current market environment. And certainly, that heavily depends on one’s current outlook and risk profile.
But it’s also instructive to consider the reverse situation—if the S&P 500 was currently setting records to the downside. Under that scenario, it’s almost assured that most market participants would be actively analyzing how to best manage risk in their portfolios.
And while the current market is at a different extreme—all-time highs—that doesn’t mean adherence to disciplined risk management practices is any less important. Especially with the VVIX/VIX ratio currently indicating that risks to the “everything rally” may be greater than most believe.
Does that mean investors and traders should bet the farm on super-bearish positions at this time? Hardly.
What it does mean is that investors and traders should likely be reviewing their overall portfolios to ensure that existing exposures match their outlooks, and adjusting accordingly.
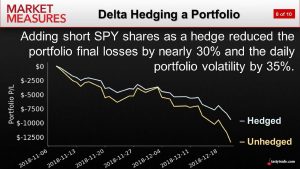
For example, those market participants currently holding a large amount of short volatility might want to consider a short delta hedge at the portfolio level—to assist with risk management in the event of a pullback. This approach was outlined in detail on a past installment of Market Measures: Delta Hedging a Portfolio on the tastytrade network.
As one can see in the chart below, delta hedging a short volatility portfolio can help reduce risks in the event of a selloff. And with the market already trading at all-time highs, the risk of it spiking further, and moving against the delta hedge, is also theoretically reduced.
While current market conditions may not dictate a specific change to one’s strategic approach at this time, it’s worth making that decision consciously, rather than being forced into an involuntary response later.
Especially with broad metrics such as the Price/Earnings Ratio of the S&P 500 and the Buffett Indicator suggesting that valuations in the stock market are currently on the expensive end of the historical spectrum.
Readers seeking to learn more about positioning in the current environment may want to review a new installment of Jones and Grace: Looking For Bearish Trades in a Bullish Market when scheduling allows.
For updates on everything moving the markets, readers can also tune into TASTYTRADE LIVE—weekdays from 7 a.m. to 4 p.m. CST—at their convenience.
Sage Anderson is a pseudonym. He’s an experienced trader of equity derivatives and has managed volatility-based portfolios as a former prop trading firm employee. He’s not an employee of Luckbox, tastytrade or any affiliated companies. Readers can direct questions about this blog or other trading-related subjects, to support@luckboxmagazine.com.