The Future Price of Predictive Policing

Palantir Technologies (PLTR) has been a much-debated battleground stock ever since its initial public offering a little more than two years ago. The company offers software that predicts the probability of crime, terrorism and other events.
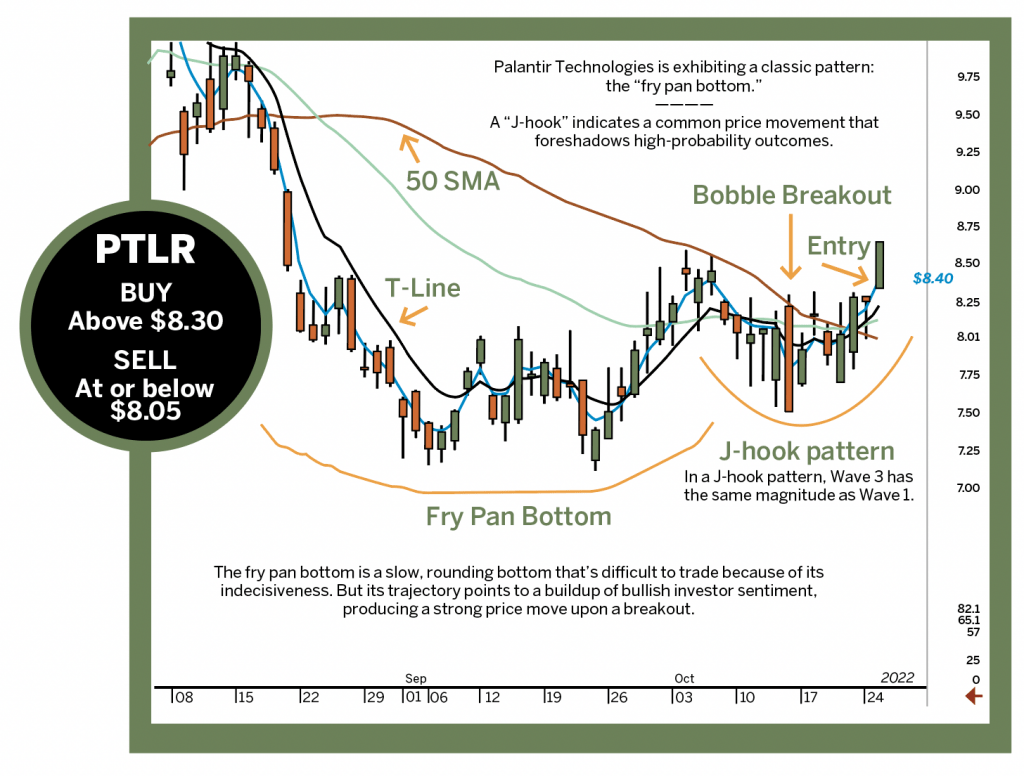
This chart shows a recent fry pan bottom pattern, a slow-rounding pattern that points to a buildup of bullish sentiment. The expected result is a strong price move to the upside.
The J-hook pattern that accompanies it is a prerequisite of a strong price move, then an indecisive pullback, followed by a new bullish wave. A bobble breakout is a more definitive J-hook pattern.
The first price move fails at an obvious resistance level, such as a moving average. It pulls back, usually using the T-line as a support, and then comes back up through the resistance level.
The bobble breakout pattern produces better bullish probabilities because everybody watches to see whether it will breach the resistance level.
Active investors might consider buying Palantir when it comes up through or closes above the 50-day moving average at approximately the $8.40 level. Once the stock closes above the 50-day moving average, a long position should be closed if it subsequently declines and closes below the 50-day moving average.

Stephen W. Bigalow, a veteran of 45 years of trading, directs a candlestick analysis learning forum at candlestickforum.com.


