Debunking the Put/Call Ratio’s Role as a Reliable Trading Signal
The Put/Call Ratio provides important insight into market sentiment. Here's how to make the most of it.

Investor and trader sentiment is on full display every day in the global financial markets. One simply has to look at the performance of the major stock market indexes to assess whether sentiment is positive or negative.
However, market participants can dig deeper when it comes to market sentiment and use that information as additional data points for assessing the current trading environment and potential investment/trading opportunities.
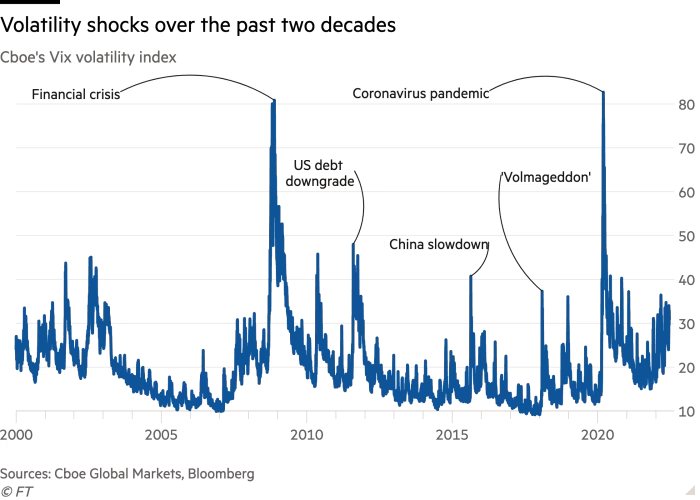
For example, the CBOE Volatility Index (VIX) is currently trading at about 25, which is roughly six points above its long-term historical average. The VIX measures short-term expected volatility in the financial markets via the price of short-term options in the S&P 500. Generally speaking, the VIX tends to rise when uncertainty in the markets is intensifying, as expectations for future movement in the stock market widen.
As most will remember, the VIX set an all-time high of 82.69 back in March 2020 as uncertainty about the COVID-19 pandemic stoked intense fear in the markets.
In 2022, the VIX has traded roughly between 16 and 37, oscillating around the metric’s long-term average of 19. Despite increased hostilities in Eastern Europe and rampant inflation, the VIX has failed to break above 40. That indicates that fear in the markets has been relatively contained in 2022—at least thus far.
Along those lines, the VVIX Index (VVIX) has also traded within a fairly reasonable range during 2022. The VVIX is nicknamed the “VIX of VIX” because it is calculated using the implied volatility of options in the VIX itself. The VVIX is said to measure the “volatility of volatility, or the “vol of vol.”
These days, the VVIX is trading about 85, which is fairly close to its 52-week low. In 2022, the VVIX has ranged between roughly 83 and 150.
Back in 2020, when the VIX surged to a new all-time high, the VVIX traded above 200. The current reading of 85 is therefore relatively low for the VVIX, and provides another important data point about sentiment in the current trading environment.
Put/Call Ratio Spikes Ahead of July 26-27 Fed Meeting
Beyond the VIX and VVIX, many market participants also track what’s commonly known as the “Put/Call Ratio.”
This ratio is fairly easy to understand and is derived from daily trading volumes in the options market. For example, when an equal number of puts and calls are traded in the S&P 500, the Put/Call Ratio is equal to 1.
However, when put activity is greater than call activity, the Put/Call Ratio rises above 1. And when call activity is greater than put activity, the ratio declines below 1.
Market participants track the Put/Call Ratio because it can provide further insight into market sentiment. For example, when investors and traders are rushing to buy puts and the Put/Call Ratio rises, that’s clearly an indication that market sentiment has turned bearish.
Back in February 2020, the Put/Call Ratio traded up to 2.40 as put buying intensified in response to the spread of COVID-19. As recently as July 19, 2022, the Put/Call Ratio was trading down to 1.13.
However, the ratio has been rallying in the days since—jumping from 1.13 on July 19 all the way to 1.53 as of July 26. This trend indicates that market participants are gravitating toward protection in U.S. options markets.
Interestingly, the U.S. Federal Reserve is set to announce its most recent decision on benchmark interest rates on July 27. Projections suggest the forthcoming interest rate hike could amount to as much as a full percentage point.
As a result of this pending decision, the recent spike in the Put/Call Ratio can likely be attributed to the forthcoming interest rate decision, as investors and traders inventory insurance (i.e. puts), to help protect against an adverse reaction in the markets in the wake of the Fed announcement.
If that is the reason, the Put/Call Ratio should retrace in the coming days. Investors and traders may therefore want to track this ratio going forward, to ensure the options market “normalizes.”
And while the Put/Call Ratio is a key indicator of market sentiment, investors and traders should tread more cautiously when it comes to using the ratio as a trading signal.
Historically, some market participants have used extreme levels in the Put/Call Ratio as an indicator for positioning in the market. For example, when the Put/Call Ratio jumps toward 2, some investors and traders have interpreted this level of bearish sentiment as a signal that the market has bottomed.
However, previous research conducted by tastytrade revealed that the Put/Call Ratio is not a reliable trading indicator. To review that research in greater detail, readers can check out this installment of The Skinny on Options Data Science.
To follow everything moving the financial markets, tune into TASTYTRADE LIVE—weekdays from 7 a.m. to 4 p.m. Central Time.
Get Luckbox! Subscribe to receive 10-issues of Luckbox in print! See SUBSCRIBE or UPGRADE TO PRINT (upper right) for more info or visit getluckbox.com.
Sage Anderson is a pseudonym. He’s an experienced trader of equity derivatives and has managed volatility-based portfolios as a former prop trading firm employee. He’s not an employee of Luckbox, tastytrade or any affiliated companies. Readers can direct questions about this blog or other trading-related subjects, to support@luckboxmagazine.com.