Shifting Focus From Herd Immunity to Higher Employment
Real gross domestic product (GDP) in the United States has nearly recovered to pre-pandemic levels, but the number of total people in the American workforce remains depressed.

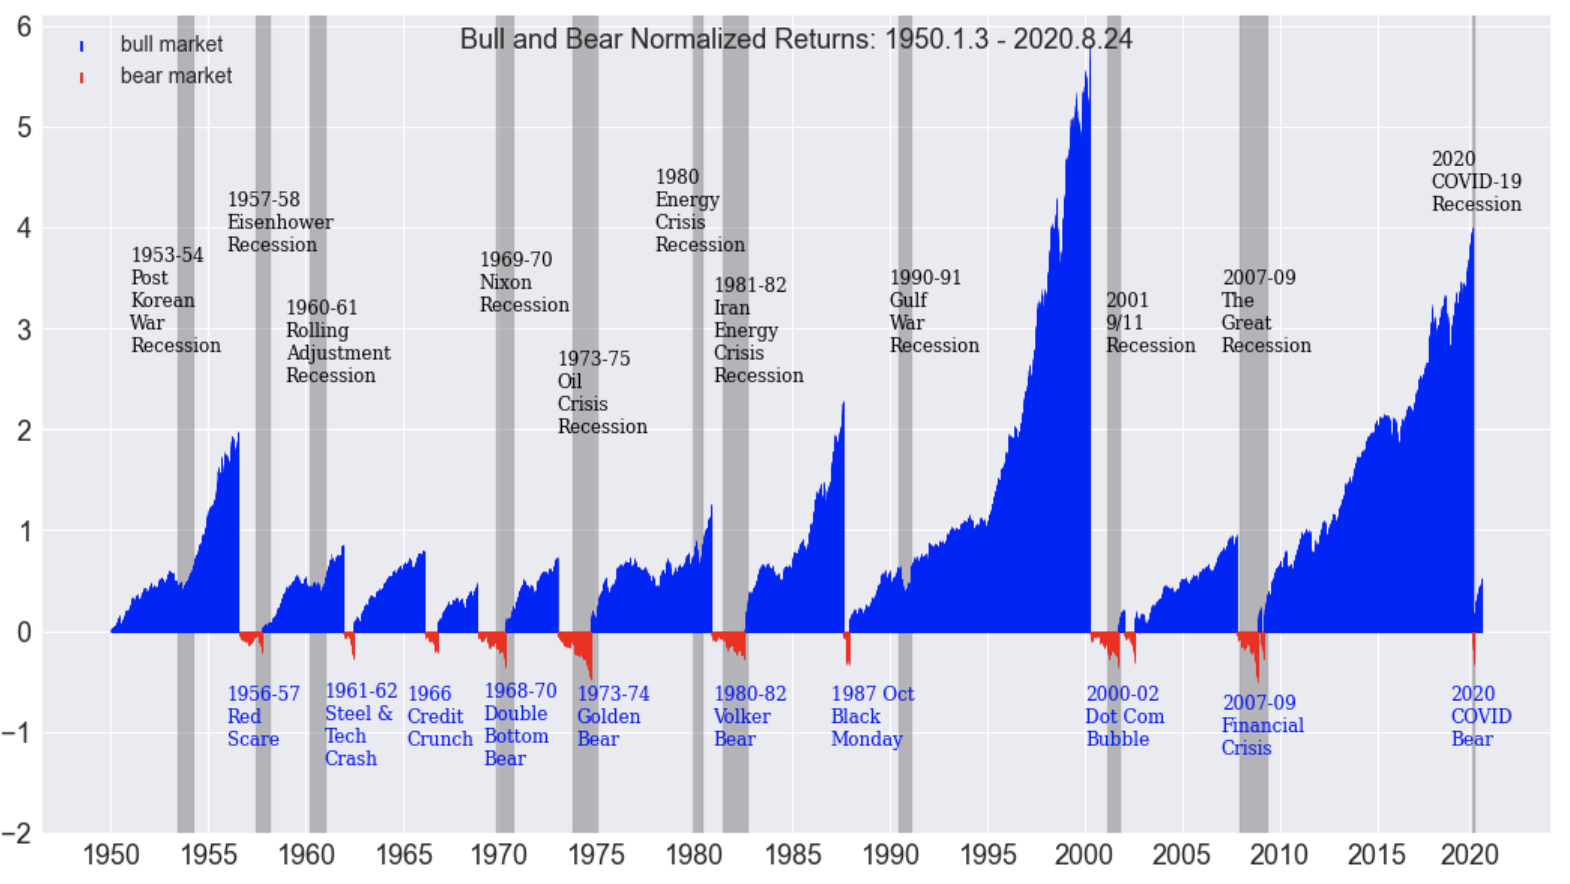
Historical trading data illustrates that when stock markets enter bear markets it’s often due to the onset of an economic recession.
That was certainly the case in the Spring of 2020, when a pandemic-induced recession pushed the S&P 500 down 34%. Stock markets are considered to be in “bear market” territory when they drop by 20% or more.
Putting that in perspective, it’s estimated that between 1926 and 2021 there have been 12 bear markets in the United States. Those bear markets have ranged in magnitude from a 21% decline to an 86% decline (the latter being the Great Depression of 1929-1932).
Of the 10 most recent bear markets, only one did not coincide with a severe economic contraction in the United States. That single bear market not running in parallel with a recession was the infamous crash of 1987, a pullback of 33%.
Given the strong historical correlation between economic recessions and stock market corrections, the status of the current COVID-19 economic recession is important. According to the several metrics, the U.S. economy may soon be emerging from it—assuming it hasn’t already.
A recession is generally defined as a state of economic contraction in which two consecutive quarters reflect a decline in GDP. A depression, on the other hand, is generally regarded as a more pronounced recession, and one that lasts a lot longer.
Last year, the U.S. officially entered a recession in Q2 when The Bureau of Economic Analysis reported that U.S. GDP growth had declined in two consecutive quarters (Q1 -4.8%, Q2 -31.4%).
However, data from 2020 also indicates that the recession was relatively short-lived, as economic growth returned in Q3 (+33.4%) and Q4 (+4.3%). And just last week, the government released the official economic numbers for Q1 2021, demonstrating a third consecutive quarter of growth at 6.4%.
Based on the last three quarters of data, the U.S. appears to have avoided an extended recession during 2020-2021. Moreover, “real GDP”—an inflation-adjusted variant of GDP—suggests that the U.S. economy has almost rebounded to the level of production observed before the pandemic began.
In February of 2019, real GDP in the U.S. was roughly $19.2 trillion. That metric dipped as low as $17.3 trillion in Q2 2020, but has since bounced back to about $19 trillion—just shy of pre-pandemic levels.

The chart above illustrates that the underlying U.S. economy has strengthened in recent months. And prior to the pandemic, a 6.4% print in quarterly GDP (as observed in Q1 2021) would have likely been considered a champagne moment.
But one can’t overlook the fact that the health of the underlying economy also hinges on the state of the workforce. Before COVID-19 spread around the globe, the U.S. unemployment rate was probing historic lows—dropping as low as 3.5% in January/February of 2020.
Unfortunately, that figure is estimated to have spiked to 14.8% in April of 2020, reaching its highest point since the Great Depression. During the 1930s, the U.S. unemployment rate is estimated to have risen as high as 25%.
Currently, the official unemployment rate is back down near 6%, but that figure doesn’t necessarily tell the full story. In absolute terms, the U.S. economy is still short about 8.5 million jobs when comparing February 2021 to February 2020 (149.5 million vs. 158.0 million).

The above numbers indicate that while overall output in the country may have rebounded, the total number of workers employed in the economy has taken a big hit.
The hope going forward is that the aggressive vaccination program being deployed across the United States will catalyze another strong surge of economic demand, which in turn will unleash a new wave of hiring. And the steady decline in new COVID-19 cases during recent weeks supports that hypothesis.
While that news is welcome, the under-employment situation in the U.S. remains worrisome. And at the end of the day, that likely indicates that the post-COVID rebound in the economy won’t be viewed as complete until more Americans are absorbed into the workforce.
Readers seeking to learn more about the strong historical correlation between stock market corrections and economic recessions can review a past installment of Market Measures on the tastytrade financial network at their convenience.
To follow everything moving the markets, TASTYTRADE LIVE—weekdays from 7 a.m. to 4 p.m. CST—is also recommended.
Sage Anderson is a pseudonym. He’s an experienced trader of equity derivatives and has managed volatility-based portfolios as a former prop trading firm employee. He’s not an employee of Luckbox, tastytrade or any affiliated companies. Readers can direct questions about this blog or other trading-related subjects, to support@luckboxmagazine.com.