Trading Extreme Oil Volatility Amid Russia-Ukraine Conflict
As tensions rise in Eastern Europe, investors and traders can use the CBOE Crude Oil Volatility Index (OVX) to track and trade volatility in the energy sector.

Unlike many modern military conflicts, the Russo-Ukrainian War isn’t being fought over crude oil.
Russia is already one of the world’s top three producers of crude oil, putting out 10 million barrels on a given day. Ukraine, on the other hand, is ranked 61st in global production—mustering only about 55,000 barrels of oil per day.
Clearly, Russia hasn’t invaded Ukraine with the intention of seizing control of the country’s scant crude oil reserves.
Importantly, however, Russia’s strategic importance in global energy markets means that the country’s involvement in any large-scale military conflict will be closely monitored by participants in the energy markets.
That’s because Russian leaders could at any time decide to leverage their energy dominance in an effort to achieve the country’s broader geopolitical goals.
If, for example, Russia were to become angered by the international sanctions levied against the country in the wake of the invasion, it could theoretically shut down some portion of its crude oil and/or natural gas exports. Alternatively, it’s equally plausible that an international coalition of countries might decide to boycott purchases of Russian energy exports.
Either case would undoubtedly represent a shock for global energy markets—assuming that the amount of crude oil or natural gas removed from the market represented a substantial portion of Russia’s total daily production.
On a daily basis, the world consumes roughly 97 million barrels of crude oil. And as a result of ongoing complications related to the COVID-19 pandemic, the crude oil supply chain is already struggling to keep up with that level of demand.
That means the removal of any meaningful degree of Russia’s 10 million barrels of daily production would add an incredible degree of stress to an already imbalanced market.
So while the Russo-Ukrainian War doesn’t revolve around a struggle for oil reserves, the ultimate impact of this conflict on the broader world community could boil down to extreme volatility in the price of oil.
Crude oil prices are already up roughly 29% year-to-date, and most projections suggest that motorists around the world will soon be feeling the pinch of the war in Eastern Europe via rising prices at the pump.
Tracking Crude Oil Volatility Using the OVX
Aside from trading crude oil using price direction (i.e. long and short), investors and traders in the energy space can also trade crude oil using volatility.
The CBOE Crude Oil Volatility Index (OVX) tracks volatility in the crude oil market much like the CBOE Volatility Index (VIX) tracks volatility in the S&P 500.
The OVX provides an up-to-date estimate of expected 30-day volatility in the crude oil market using options from the United States Oil Fund (USO). Interpreting the OVX is relatively easy, as it is very similar to the VIX.
For example, if crude oil is trading $100/barrel, a reading of 20 in the OVX would suggest that in the next 12 months, crude oil prices would be expected to settle somewhere between $80 and $120 (20% of $100 = $20), with roughly a 68% degree of confidence.
Furthermore, this example would suggest that crude oil would be expected to finish the next 12 months trading between $60 and $140 with a 95% degree of confidence, or between $40 and $160 with a 99.7% degree of confidence.
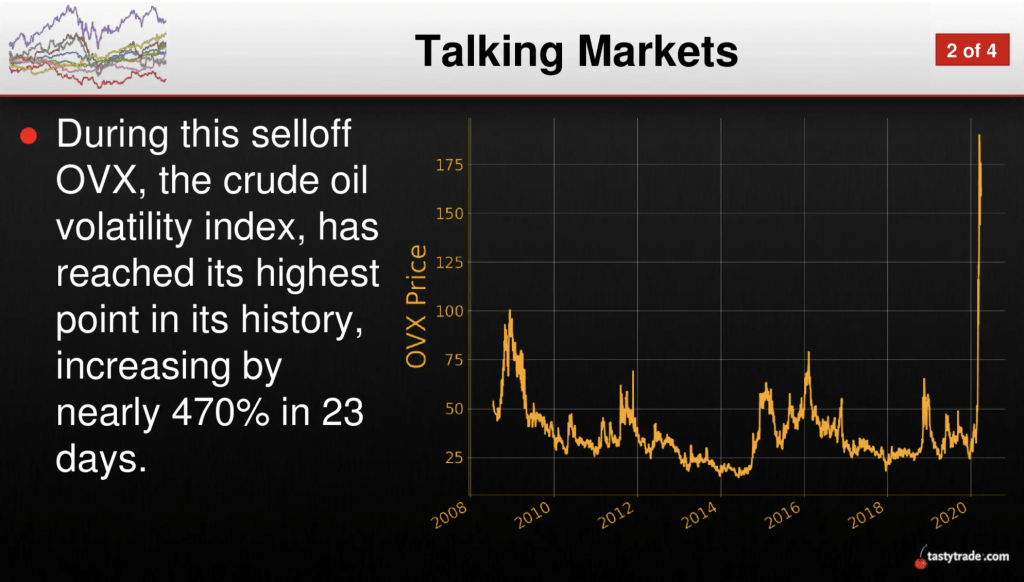
Currently, the OVX is trading 49.50 and has ranged between roughly 26 and 102 during the last 52 weeks. Since Feb. 9, the OVX is up roughly 25%, having risen from roughly 39.50 to 49.50.
The all-time high in the OVX was observed during March of 2020, when the metric skyrocketed above 190 during the onset of the COVID-19 pandemic, as illustrated below.

Trading Crude Oil Volatility
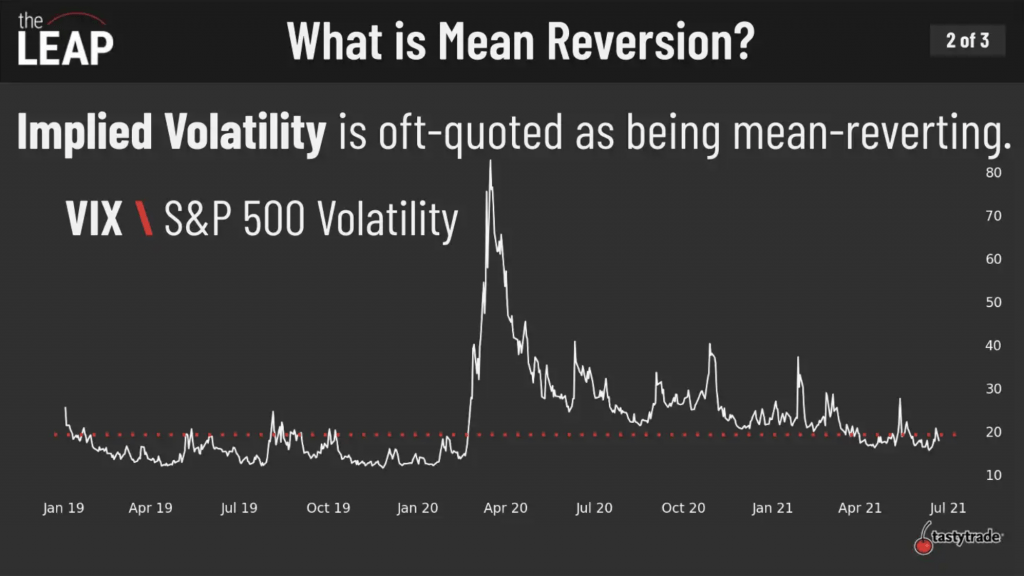
As most market participants are well aware, volatility in the financial markets has proven over time to be mean-reverting.
In the trading world, mean reversion refers to the tendency of financial instruments to move toward their average price over time. Historical data has demonstrated beyond any reasonable doubt that volatility also tends to move toward its average over time.

Accordingly, investors and traders often buy/sell volatility when they view it as too cheap or too expensive.
Looking at an example, imagine that the 30-day historical volatility of stock XYZ is 20, and implied volatility (market volatility) for options with a one-year duration is priced at 30. In this case, an opportunity theoretically exists to sell options in stock XYZ with the expectation that actual volatility will be less than what the market is pricing.
If an investor/trader sells 30% volatility, and the underlying XYZ moves on a 20% volatility (as it had historically), then the position will produce a profit.
While most investors and traders track the VIX to monitor potential options/volatility opportunities, the OVX is likewise valuable when one is considering trading a single stock or ETF from the crude oil sector.
At present, the OVX is trading about 20% higher than the average level observed in 2021, which was about 37. However, a little extra premium in the OVX might be appropriate at this time, considering the uncertainty associated with the Russian-Ukrainian conflict.
With the war in Ukraine still in the early stages, it’s entirely possible the OVX could rally significantly higher in the foreseeable future, thus providing an even more attractive entry point for potential options sellers in the energy sector.
Going forward, investors and traders may therefore want to add the OVX to their watchlists in order to track and trade potential opportunities in the crude oil sector that may stem from ongoing developments in Eastern Europe.
To learn more about trading crude oil volatility, readers are encouraged to review a past installment of Market Measures on the tastytrade financial network. More information on mean reversion in the financial markets is also accessible via this episode of The Leap From Options to Futures.
To track everything moving the financial markets on a daily basis, readers can also tune into TASTYTRADE LIVE weekdays from 7 a.m. to 4 p.m. Central Time at their convenience.
Get Luckbox! Subscribe to receive 10 issues of Luckbox in print! See SUBSCRIBE or UPGRADE TO PRINT (upper right) for more info or visit getluckbox.com.
Sage Anderson is a pseudonym. He’s an experienced trader of equity derivatives and has managed volatility-based portfolios as a former prop trading firm employee. He’s not an employee of Luckbox, tastytrade or any affiliated companies. Readers can direct questions about this blog or other trading-related subjects to support@luckboxmagazine.com.


