Trading Shifts in the 200-Day Moving Average
In late January 2022, the S&P 500 dropped below its 200-day moving average, a development that sometimes (but not always) precedes a serious market pullback.

When moving averages reach inflection points, they tend to catch the attention of investors and traders. So when the S&P 500 breached its 200-day simple moving average to the downside on Jan. 21, most market participants stood up and took notice.
Moving averages—couched within the “technical analysis” philosophy of investing/trading—are viewed as helpful in analyzing longer term trends in a single stock, a stock index, or pretty much any other investable/tradable asset that can be viewed on a price chart.
In the most basic terms, a simple moving average (SMA) calculates an asset’s average closing price over a set window of time. SMAs typically appear as a line on a price chart and can help investors and traders identify emerging trends.
The 200-day moving average in the S&P 500 is one of the most-followed SMAs, and is calculated by adding the closing prices of the last 200 sessions for the S&P 500, and dividing that sum by 200—then repeating the next day, and so on.
The 200-day SMA is usually represented as an arching line on a price chart, as shown in the example below, which illustrates how the S&P 500 breached its 200-day SMA to the downside during the onset of the COVID-19 pandemic in early 2020. And then again to the upside later in the year.

In the above instance, one can see how the breaching of the 200-day SMA ended up representing a rather dramatic change in trend. But one should keep in mind that isn’t always the case.
In general, when an underlying remains above its 200-day moving average, that’s viewed as constructive, and the continuation of an uptrend. But when the price of security dips below its 200-day moving average (as illustrated above), that’s viewed as the breaching of an important support level.
Some market participants use additional moving averages, beyond the 200-day. For example, many technical analysts monitor the 200-day SMA in tandem with the 50-day SMA.
When the 50-day SMA crosses to the downside of the 200-day SMA, that is commonly referred to as a “death cross.” Such moves can (but not always) signal a bear market—in a stock, index, or any other asset that’s viewed on a price chart.

The chart above highlights a “death cross” in the S&P 500 from December of 2018, an event that did not end up being representative of a significant bear market, as the S&P 500 proceeded to rally into the start of 2019, and beyond.
That means the S&P 500’s recent breach of the 200-day SMA (on Jan. 21) could also be relatively insignificant in the grand scheme of things.
So what can investors and traders infer from the breaching of the 200-day moving average in a major stock index? According to research conducted by tastytrade, past breaches of the 200-day moving average in a major stock index didn’t reveal anything definitive, in terms of predictive takeaways.
However, research into past breaches of the 200-day SMA in the major stock indices (Nasdaq, S&P 500, Russell 2000) did reveal several overarching trends that may prove useful to investors and traders.
For example, an examination of historical price data in those three major indices from the year 2000 to present revealed that the indices tend to trade for 20+ days below the 200-day moving average, once a breach occurs, as outlined below.
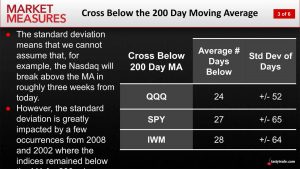
As shown above, the three major stock indices in the U.S. have averaged between 24 and 28 days below the 200-day SMA, once the index first drops below the 200-day SMA.
Additionally, historical data revealed that such an event doesn’t necessarily precede a bear market.
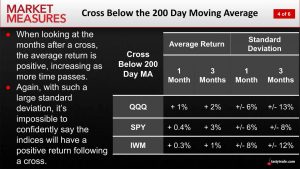
On average, the major indices generated positive returns in the three months following such a breach. Although those returns were certainly nothing to write home about, as illustrated below.
Parting Shots
Good decision-making is integral to any successful investing/trading endeavor. And the ability to make good decisions is usually founded on the availability of useful, plentiful, and relevant data.
Of course, the type of data utilized by a given investor/trader might be vastly different from the data utilized by another.
For example, an options trader might rely heavily on volatility data, whereas a fundamental trader might rely on earnings-related data (e.g. sales, profitability, etc.). On the other hand, technical analysts in the market typically focus on price and volume data.
But no matter one’s specific strategy, building awareness of key market data—even outside one’s preferred discipline—is highly recommended.
In that spirit, investors and traders may want to monitor SMAs like the 200-day or 50-day going forward in order to build better market awareness.
While these metrics may not serve as guaranteed trading/investing signals per se, they can provide valuable insight into potential trend changes—especially when these moving averages reach important inflection points (i.e. a death cross).
To learn more about tastytrade’s research on 200-day SMAs, readers are encouraged to review this new installment of Market Measures.
To follow everything moving the financial markets, readers can also tune into TASTYTRADE LIVE—weekdays from 7 a.m. to 4 p.m. CST—at their convenience.
Sage Anderson is a pseudonym. He’s an experienced trader of equity derivatives and has managed volatility-based portfolios as a former prop trading firm employee. He’s not an employee of Luckbox, tastytrade or any affiliated companies. Readers can direct questions about this blog or other trading-related subjects, to support@luckboxmagazine.com.