Trading the Crude Oil Correction
Crude oil prices corrected by about 20% in November, and that has opened up fresh opportunities to trade volatility (and direction) in the energy sector.
Volatility struck the financial markets hard after Thanksgiving as global asset prices plummeted on news that a new COVID-19 variant known as “omicron” was spreading across the globe.
One of the hardest-hit corners of the market was the energy sector, where crude oil prices corrected by about 20%.
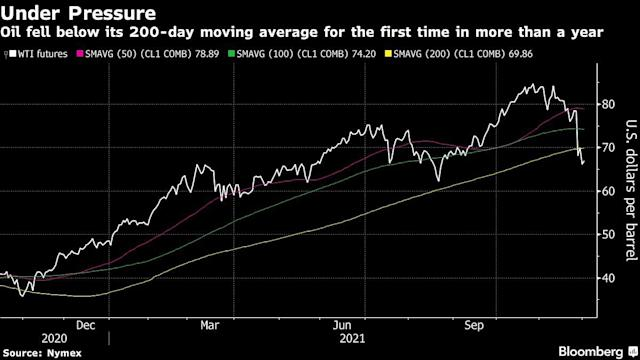
Crude oil started the month of November trading nearly $85/barrel but ended the month just over $65/barrel as concerns over a slowing global economy (i.e. lockdowns) pushed down demand expectations in the energy sector.
The swift drop in prices, combined with a sharp pop in volatility, could translate into new opportunities for investors and traders active in the energy sector.
The CBOE Crude Oil Volatility Index (OVX) ended November trading above 80, which was more than double the average level observed through most of 2021. The last time the OVX was above 80 it climbed all the way to 170 during the onset of the COVID-19 pandemic in March 2020.
Interestingly, crude oil and gasoline had been cited frequently in recent months as an illustration of the ongoing inflation crisis. In October, the consumer price index (CPI) demonstrated that consumer prices had risen by about 6.2% over the last 12 months—much of that driven by food and energy costs.
As evidence of that trend, gasoline prices had risen to a nationwide average of $3.42, a seven-year high. That level is about 80 cents higher than the nationwide average observed in November 2019, prior to the onset of the pandemic.
Interestingly, the emergence of the omicron variant appears to have flipped the inflation narrative upside down, at least in the energy sector. A 20% drop in crude oil prices will undoubtedly push down prices at the pump, helping to alleviate at least a portion of rampant consumer inflation.
The big question is whether energy prices will stay down. And it’s certain investors and traders active in the energy sector are placing bets on that question at this very moment.
Extreme spikes in volatility don’t usually last that long, which means the current trading environment may be attractive for getting short options/volatility.
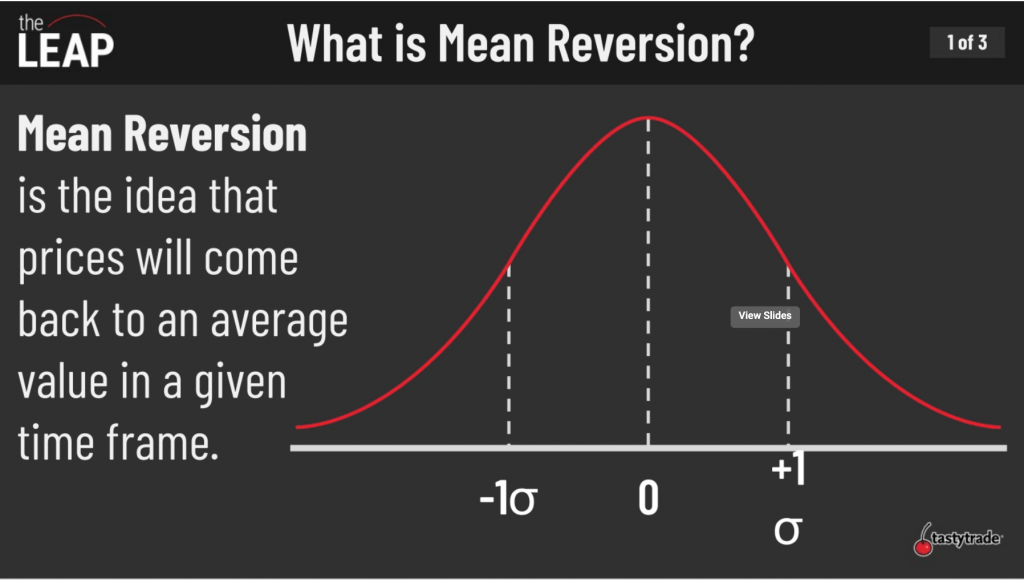
As most tastytraders are already well aware, volatility in the financial markets has proven over time to be mean-reverting.
In the finance world, mean reversion describes the tendency of financial instruments to move toward their average price over time. Historical data has demonstrated beyond any reasonable doubt that volatility also tends to move toward its average over time.
Accordingly, investors and traders often buy/sell volatility when they view it as too cheap or too expensive.
For example, if the one-year average historical volatility of stock XYZ is 20, and implied volatility (market volatility) for options with a one-year duration is priced at 30, an opportunity theoretically exists to sell that option with the expectation that actual volatility will trend lower—toward its historical average. In this case, that would involve the implied volatility of XYZ dropping from 30 toward 20.
While most investors and traders track the CBOE Volatility Index (VIX) to monitor potential options/volatility opportunities, the CBOE Crude OIl Volatility Index (OVX) is likewise a valuable metric to follow.
Considering that the OVX has averaged just under 40 over the last 12 months, and is currently trading closer to 80, that suggests options associated with the crude oil sector are currently trading at relatively “rich” valuations, and may therefore be prime candidates for short volatility positions.
To identify specific opportunities, it can be helpful to refer to metrics like Implied Volatility Rank (aka IV Rank or IVR). IV Rank reports whether implied volatility is high or low in a specific underlying based on the past year of implied volatility data.
For example, if hypothetical stock XYZ saw implied volatility range between 30 and 60 over the past year and implied volatility is currently at 45, XYZ would have an IVR of 50%. If implied volatility was currently trading 60 in XYZ, then IVR would be 100%.
Volatility traders usually look to sell options/volatility when IV Rank is above 50%—although the threshold can vary by trading environment.
To learn more about trading crude oil volatility, readers are encouraged to review a past installment of Market Measures on the tastytrade financial network. More information on mean reversion in the financial markets is also accessible via this recent episode of The Leap From Options to Futures.
For timely updates on everything moving the financial markets, readers can also tune into TASTYTRADE LIVE—weekdays from 7 a.m. to 4 p.m. Central Time at their convenience.
Get Luckbox! Subscribe to receive 10 issues of Luckbox in print! See SUBSCRIBE or UPGRADE TO PRINT (upper right) for more info or visit getluckbox.com.
Sage Anderson is a pseudonym. He’s an experienced trader of equity derivatives and has managed volatility-based portfolios as a former prop trading firm employee. He’s not an employee of Luckbox, tastytrade or any affiliated companies. Readers can direct questions about this blog or other trading-related subjects, to support@luckboxmagazine.com.