Trading the Recent Divergence in Oil and Gas Prices
During July and August, oil and gas prices have been moving in opposite directions, which represents a divergence from their traditional trading relationship.

The energy sector was one of the market’s biggest movers in H1 2022, and that trend has extended through July and into August.
Since peaking in early June, crude oil prices have been trending steadily lower—dropping by roughly 26% over the last nine weeks. Today, crude oil is trading about $89/barrel, which is still about $15/barrel above where it started.
The recent correction in oil prices has made the $120-level that was observed during mid-summer now seem like a fever dream, as bearish sentiment has tightened its grip on the market.
Interestingly, however, the energy sector isn’t reeling as a whole. Contrary to trends observed in the oil patch, natural gas prices have actually rallied hard in recent weeks, jumping from roughly $5.50/mmBtu to $9.30/mmBtu since early July—a gain of nearly 70%.

The recent divergence in oil and gas prices is notable because the two have historically shared a relatively strong positive correlation. In the last 20 years, the correlation between the two has ranged between roughly 0.25 and 0.60.
In simple terms, the correlation between two asset prices is the extent to which price movement in one asset shows similarity with that of price movement in the other asset. Market correlations are expressed as a number between negative one and positive one.
Correlations can also be characterized as weak, semi-strong, or strong—depending on the degree to which two underlyings are linked.
For example, 0.15 might be considered a weak positive correlation, whereas 0.75 might be considered a strong positive correlation. On the other hand, -0.20 might be considered a weak negative correlation, while -0.80 might be referred to as a strong negative correlation.
With oil and gas exhibiting a relatively strong correlation at times during the last couple of decades, it’s somewhat of a surprise to see one of these energy commodities rallying, while the other is reeling.
There are qualitative explanations that can help explain why the traditional relationship between the two has broken down. But, it’s important to keep in mind that highly correlated underlyings which diverge from their normal trading pattern tend to revert to that pattern eventually.
For this reason, investors and traders may want to keep a closer eye on both of these commodities going forward to identify potential trading opportunities.
Trading Price Divergences in Highly Correlated Pairs
As of late summer, the rally in natural gas prices has been attributed to widespread shortages in Europe, where gas prices are even higher than they are in the United States.
With fall/winter on the horizon, these shortages are expected to intensify—specifically as a result of market complications stemming from the Russia-Ukraine War. Strong demand for American natural gas via the export market is, therefore, the primary force driving prices higher domestically.
Those same forces also pushed crude oil prices higher earlier in the year, and as recently as June. However, the crude oil market has purportedly cooled down for two main reasons.
The first relates to the economic contraction that has taken hold not only in the U.S., but also in China. A slowing Chinese economy almost always serves as an anchor on oil prices because the country imports such a large percentage of its annual consumption—roughly 80%, by most estimates.
The other force driving oil prices lower is said to be rooted in the Middle East. Prevailing opinion at this time indicates that the Middle East—and particularly OPEC—are planning to ramp up oil exports in the coming months. This development is also a bearish development for crude oil because rising supply almost always translates to declining price.
However, the precise reasons for recent price action in the crude oil and natural gas markets don’t really matter—at least not for pairs traders. The most important thing is that oil and gas are currently moving in opposite directions, which is an aberration from their past trading behavior.
Structurally, pairs trading involves taking the opposite position in two different underlying securities, or two different maturities in the same underlying security. The key to pairs trading is that it relies on a known, strong correlation (positive or negative) that exists between two underlyings.
At a high level, imagine that price movement between Exxon Mobil (XOM) and Chevron (CVX) enjoy a high degree of positive correlation (they do). If one can see that a correlation has existed for a long period of time, but that in the near-term a price divergence has occurred, a trader utilizing the pairs approach might believe an opportunity has presented itself.
The same could be said for oil vs. natural gas, gold vs. silver, or wheat vs. corn—and many other such pairs. The key is that a strong positive or negative correlation has been established between the two over a long period of time and that it is expected to continue (a.k.a. revert to normal).
Along those lines, it’s likely that some pairs traders are diving into the energy space—pairing long oil and short natural gas.
Pairs trading requires a trader to take an opposite but equal position in two different securities (or two different maturities of the same security), which means the bet taken is ultimately that the spread between the two prices narrows or widens—depending on the position taken.
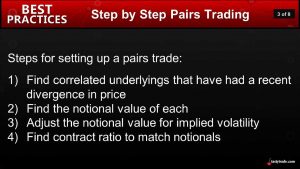
At its core, a pairs trade represents the expression of an opinion on the direction of the spread. Taken all together, the pairs trading process typically encompasses four main steps, as illustrated in the graphic below.
It’s possible that some market participants may prefer to take a lone position in natural gas or crude oil, rather than deploying a pairs spread at this time. Especially if one considers oil to be in oversold territory, or natural gas to be in overbought territory. Alternatively, an energy “mega bull” might decide that both commodities look attractive heading into fall/winter.
For a complete rundown on the step-by-step pairs trading process, check out this episode of Options Jive on the tastytrade financial network. For more background on market correlations, view this installment of Market Measures.
To follow everything moving the financial markets on a daily basis, tune into TASTYTRADE LIVE—weekdays from 7 a.m. to 4 p.m. CDT.
Sage Anderson is a pseudonym. He’s an experienced trader of equity derivatives and has managed volatility-based portfolios as a former prop trading firm employee. He’s not an employee of Luckbox, tastytrade or any affiliated companies. Readers can direct questions about this blog or other trading-related subjects, to support@luckboxmagazine.com.