VVIX: Measuring the Volatility of VIX
When the VIX starts ripping, many traders expand their watchlists to include additional volatility products such as VXX, SVXY and UVXY—as outlined recently by luckbox.
Another parameter that tends to draw extra attention during sharp corrections is VVIX. This metric is effectively the “VIX of VIX” as it reports on implied volatility in the VIX, as shown below:
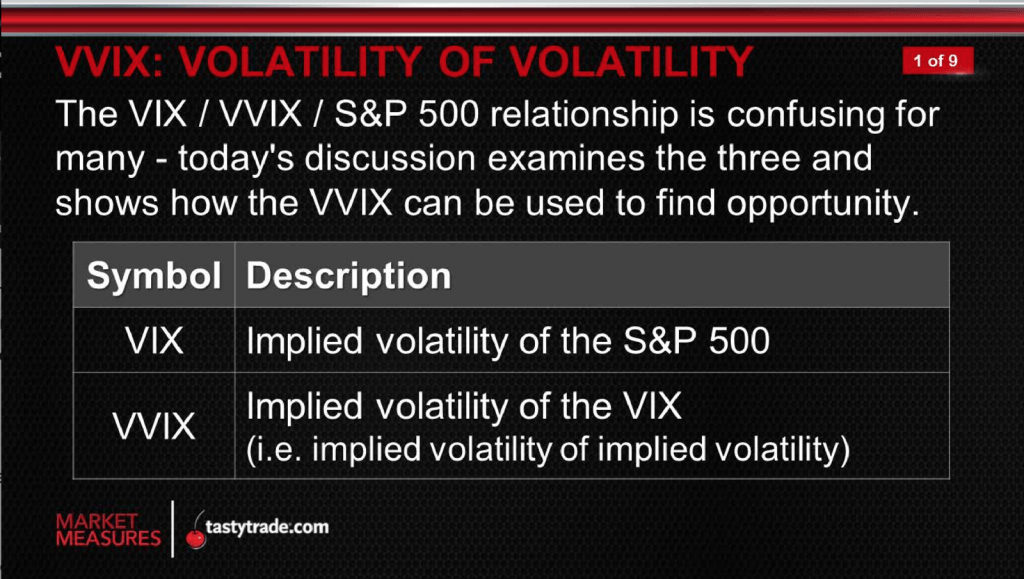
The VIX is calculated using the implied volatility of options in the S&P 500. As implied volatility rises in S&P 500 options, so too does the VIX.
Alternatively, the VVIX is calculated using the implied volatility of options in the VIX itself. The VVIX is therefore often said to measure the “volatility of volatility,” or the “vol of vol.”
Thinking through the mechanics of the VIX and VVIX, it stands to reason that as the VIX rises, the VVIX should also go higher (and vice versa). This relationship is illustrated in the chart below, using historical data in VIX and VVIX:
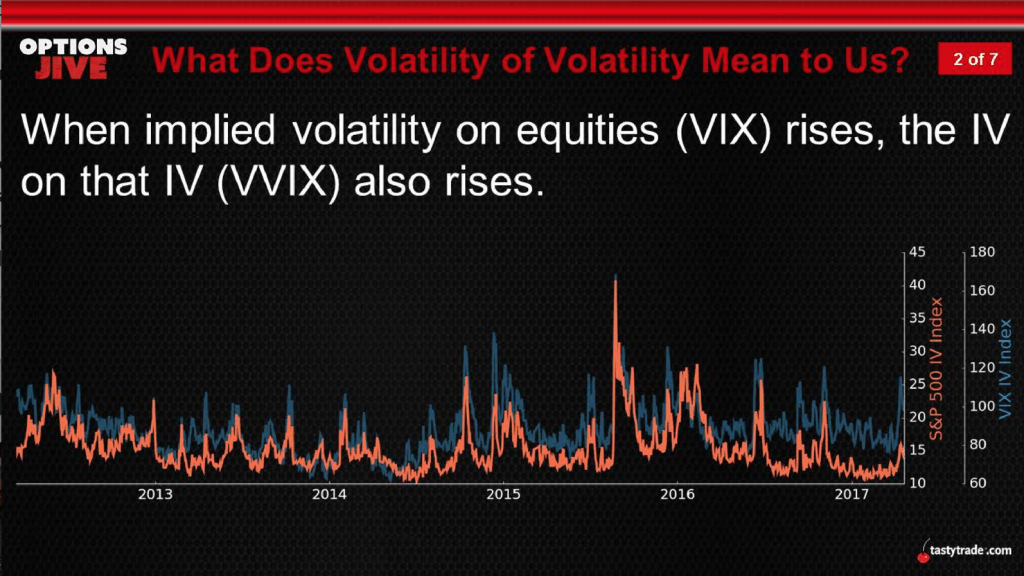
Interestingly, while VIX and VVIX are closely intertwined, they are not perfectly correlated. An examination of the historical correlation between the two by tastytrade revealed a correlation of about 0.75.
Those wondering why the two don’t always move together might imagine the following hypothetical situation: If VIX were to spike to 49 (as it did recently), one could safely assume the VVIX would also make a big move higher (it did).
Now imagine that the VIX were to drop from 45 to 43. In this case, it’s entirely possible that implied volatility reported by VVIX would not decline, given that a VIX reading above 40 still qualifies as well above its historical average.
Implied volatility in VIX options might, under this scenario, remain firmly bid given that the VIX could still theoretically make a big move in either direction. This is just one example of a situation in which VIX and VVIX might not move in perfect unison.
Accordingly, VIX and VVIX move in an uncorrelated manner about 24% of the time. tastytrade research on historical movement in VIX and VVIX revealed the following additional insights on their respective respective behavior relative to one another:
- VIX up, VVIX up: 34% of the time
- VIX up, VVIX down: 13% of the time
- VIX down, VVIX up: 11% of the time
- VIX down, VVIX, down: 42% of the time
So how can traders take advantage of this?
For starters, traders closely following and trading the VIX can learn a lot about the potential performance of VIX positions through the behavior of VVIX.
The graphic below highlights how a variety of options positions deployed in the VIX might theoretically perform based on movement in both VIX and VVIX:
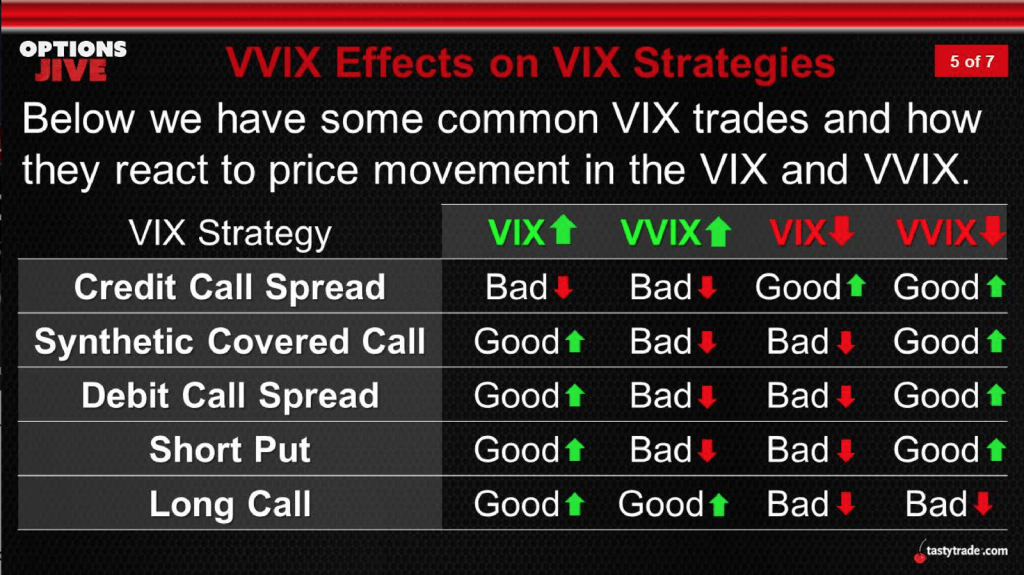
Depending on one’s outlook in VIX and VVIX, the above table could be used to assist with building potential positions intended to capitalize on expectations for ongoing volatility in the financial markets.
It may be helpful to note that the recent historical range in VVIX has been between 60 and 150, translating to a mean value of about 86 in the VVIX.
The VVIX closed trading on March 9 at about 137, while the VIX closed at 54. The intraday high in VVIX on Monday was 160.
The VVIX has climbed above 200 only twice previously since the metric was first conceived in 2006.
Given the sharp volatility observed in recent days, it’s entirely possible that VVIX could cross 200 again at some point in the near future.
In terms of the “volatility of volatility,” that would represent a fairly significant event, and also maybe a top in volatility.
For more information on VVIX readers can review a previous installment of Options Jive on the tastytrade financial network when scheduling allows.
Sage Anderson is a pseudonym. The contributor has an extensive background in trading equity derivatives and managing volatility-based portfolios as a former prop trading firm employee. The contributor is not an employee of Luckbox, tastytrade or any affiliated companies. Readers can direct questions about topics covered in this blog post, or any other trading-related subject, to support@luckboxmagazine.com.