VVIX/VIX Ratio Flashes Red: Trading Key Risk Metrics During a Correction
Rising tensions in Eastern Europe have altered the risk dynamic on Wall Street, with the VIX breaking above recent resistance, and the VVIX/VIX ratio likewise trending toward an extreme.

In the wake of Russia’s invasion of Ukraine, the market’s best-known “fear gauge” (i.e. VIX) broke above 30, while another popular Wall Street risk metric—the VVIX/VIX ratio—also made a big move.
Read on to learn more about the VIX, the VVIX, and the VVIX/VIX ratio, which together comprise some of the most important instruments that investors and traders can use to track and trade risk in the marketplace.
VIX Breaks Above Recent Resistance
When markets pick up speed—especially to the downside—it can be overwhelming for investors and traders.
That’s why a disciplined, mechanical approach to trade identification, portfolio management and risk management is paramount during such periods.
And to objectively assess the current trading environment, investors and traders can utilize risk metrics such as the VIX, the VVIX and the VVIX/VIX ratio.
For example, the CBOE Volatility Index (VIX) had been trading between 15 and 30 since February of last year. But on March 1, 2022 the market’s best-known fear gauge finally broke out of that range.
On the first day of March, the VIX jumped roughly 14% and closed just under 35. That may be a signal that the risk dynamic in the financial markets has shifted and that the peak in volatility may still lie ahead.

Understanding the VVIX
During tumultuous periods in the financial markets, market participants often monitor the CBOE VIX Volatility Index (VVIX), as well as the regular VIX.
As most are aware, the VIX is calculated using the implied volatility of options in the S&P 500. As implied volatility rises in S&P 500 options, so too does the VIX.
Alternatively, the VVIX is calculated using the implied volatility of out-of-the-money (OTM) put options in the VIX itself. That’s why the VVIX is often said to measure the “volatility of volatility,” or “vol of vol.”
At present, the VVIX is trading 133.75, which is well above the metric’s long-term average of about 90. That trend provides further evidence that risk perceptions in the market are changing.
For context, the all-time high in the VVIX is roughly 207—a mark that was set during the onset of the COVID-19 pandemic during March of 2020.
VVIX/VIX Ratio Trends Toward an Extreme
Beyond monitoring absolute levels in the VIX and VVIX, many market participants also track changes in the relationship between those two metrics using the “VVIX/VIX ratio.”
When the VVIX/VIX ratio hits an extreme, it can be a strong indicator of either intense market volatility, or tranquil market complacency.
For example, during the chaotic market correction observed during March of 2020, the VVIX over VIX ratio dropped to 2.5 (207/82 = 2.5).
In comparison, the VIX posted one of its lowest closing prices of all time at 9.10 on Oct. 5, 2017. That same day, the VVIX closed trading just over 91—meaning the VVIX/VIX ratio was roughly 10 (91/9 = 10) on that historically complacent day.
Based on that data, one can see the VVIX/VIX ratio has ranged between roughly 2.5 (when market volatility was peaking) and 10 (when market volatility was historically complacent) during recent years.
Currently, the VVIX/VIX ratio is trading at 3.8 (135/35 = 3.8). That’s significantly lower than the start of 2022, when the ratio was trading around 6.8 (108/16 = 6.8).
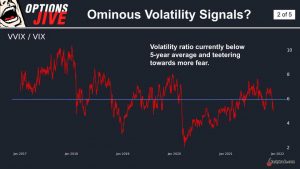
The above trend provides investors and traders with even more insight into the risk dynamic of the current trading environment.
And while there’s no telling how low the VVIX/VIX ratio could go during the current bout of volatility, the aforementioned data provides investors and traders with some important reference points, should market volatility intensify further.
Going forward, market participants may want to keep a close eye on the VIX, the VVIX, and the VVIX/VIX ratio to assist with risk-oriented decision-making—whether that be assessing new positions, or managing risk in the overall portfolio.
To learn more about trading the VIX, readers are encouraged to review a new installment of Options Jive on the tastytrade financial network. For tips on handling extreme uncertainty in the financial markets, this new episode of From Theory to Practice is also recommended.
To track everything moving the financial markets on a daily basis, readers can also tune into TASTYTRADE LIVE—weekdays from 7 a.m. to 4 p.m. CST—at their convenience.
Sage Anderson is a pseudonym. He’s an experienced trader of equity derivatives and has managed volatility-based portfolios as a former prop trading firm employee. He’s not an employee of Luckbox, tastytrade or any affiliated companies. Readers can direct questions about this blog or other trading-related subjects, to support@luckboxmagazine.com.