Will Inflation Push Gold to a New All-time High?
The price of gold recently hit a five-month high and is trading just 9% below its all-time high, setting up the potential for a dramatic finish to the year.
After a slow summer, the precious metals trade has suddenly come alive.
Over the course of the last six weeks, gold prices have charged to a five-month high, and are now trading only 9% below their all-time closing high of $2,036/ounce.
Many have attributed recent moves in the gold market to rising inflation. But inflation has been a concern for many months, suggesting there might be more to this emerging precious metals story.
Looking more closely at gold’s historical price chart, one can see that gold hit its all-time high in July of 2020—at a time when the COVID-19 pandemic was raging with no vaccine in sight.

While case numbers are rising in Europe at the moment, COVID-19 doesn’t appear to have a strong grip in the United States. As of Nov. 17, there were about 85,000 new cases of the coronavirus reported in the U.S., which is well below the 200,000+ daily cases observed when a “new wave” rolls across the country.
That means looking beyond the pandemic and inflation stories, it’s entirely possible that the “momo” crowd has simply moved into a new sector of the market, and is trying to make a quick buck.
[Up next at Luckbox: The Issue with Inflation will release on 11/30. Not a subscriber? Get Luckbox free at getluckbox.com]
Silver prices have also been running of late, with the price jumping from about $21.50/ounce at the end of September, all the way to $25/ounce in mid-November. That’s an appreciation of 16% in about six weeks, which is nothing to sneeze at.
Considering the recent moves in gold and silver, it’s also worth checking in on the Gold/Silver Ratio, which is a great metric to monitor when the precious metals sector moves into the market spotlight.
The Gold/Silver Ratio is calculated by simply taking the price per ounce of gold and dividing it by the price per ounce of silver. The quotient of that equation reports how many ounces of silver are required to buy a single ounce of gold, at a given point in time.
During the onset of the pandemic, the furious rally in gold prices pushed the Gold/Silver Ratio to multi-year highs, when it climbed as high as 115 in April of 2020.
At present, the Gold/Silver Ratio is trading a lot closer to its recent average, clocking in at 74 ($1.867/$25 = 74). Many market participants in the precious metals space look for opportunities to trade gold and silver as a pair when the Gold/Silver Ratio moves to an extreme—below 60 or above 90, for example.
However, with the ratio currently trading around 75, this may not be the right time for that particular trade structure.
Gold/Silver Ratio Over Time
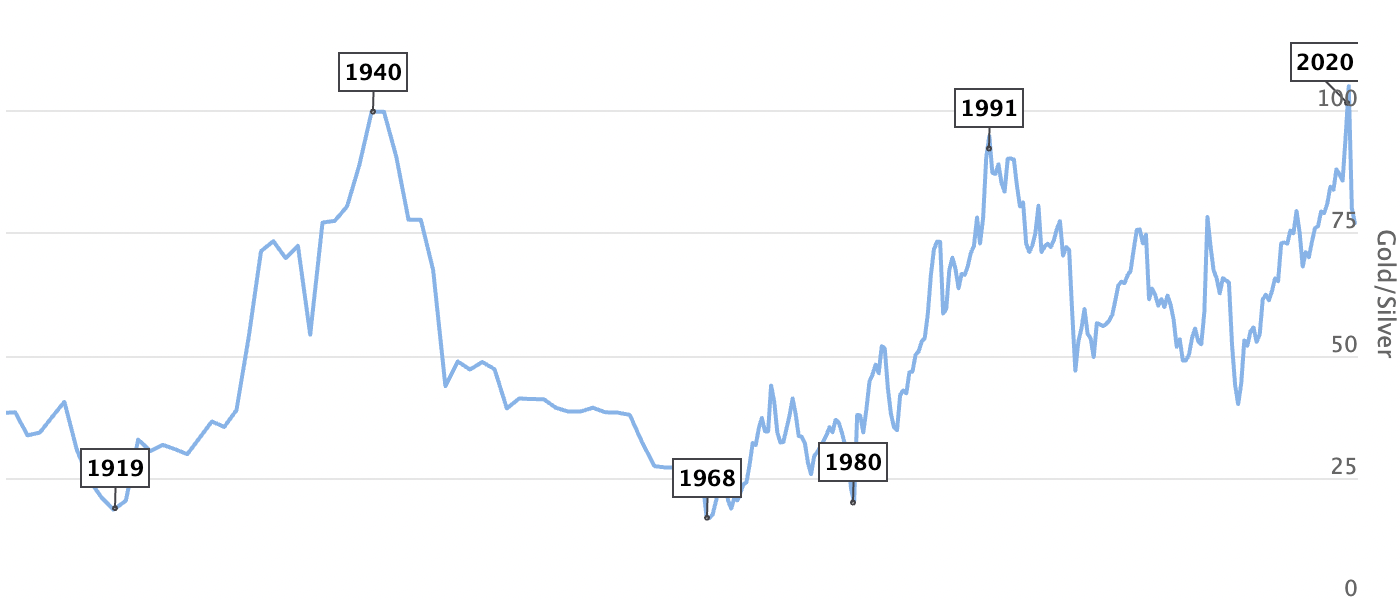
Source: longtermtrends.net
Bullish investors and traders of precious metals might instead be drawn to the recent breakout to the upside, and see opportunity in the space from a technical perspective.
Alternatively, investors and traders can also trade the space using options. Volatility in the precious metals space often rises when gold and silver are rallying, which can open up opportunities for selling covered calls, or deploying other short volatility structures.
Precious metals are somewhat unique because in most cases the correlation between price direction and volatility is negative—meaning when prices are falling, associated volatility tends to rally.
But due to gold’s status as a “safe haven,” volatility and price direction historically share a positive correlation. That’s because rallies in the gold market are often driven by fear, which is why volatility in the space tends to move higher along with underlying prices.
To track gold volatility, investors and traders can add the CBOE Gold Volatility Index (GVZ) to their watchlists, which is effectively the “VIX of gold.” During the height of the chaos in the markets during March of 2020, the GVZ briefly traded above 40. As of late November, it’s trading about 17.
To learn more about trading the precious metals sector, readers can review this previous installment of Options Jive on the tastytrade financial network.
For timely updates on everything moving the financial markets, readers can also tune into TASTYTRADE LIVE—weekdays from 7 a.m. to 4 p.m. CST—at their convenience.
Sage Anderson is a pseudonym. He’s an experienced trader of equity derivatives and has managed volatility-based portfolios as a former prop trading firm employee. He’s not an employee of Luckbox, tastytrade or any affiliated companies. Readers can direct questions about this blog or other trading-related subjects, to support@luckboxmagazine.com.